4% Advance & Decline script
TradingView Script
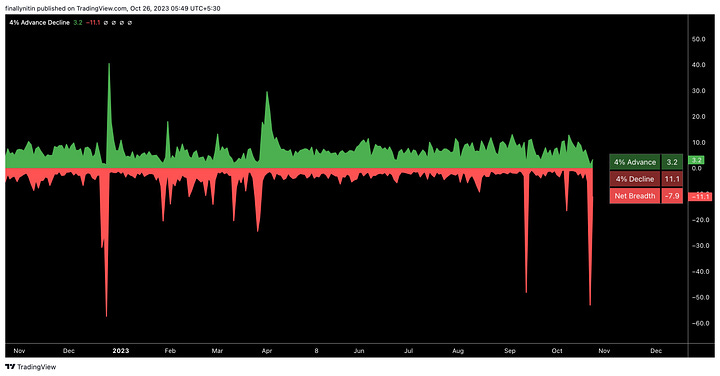
In the series of market breadth indicators, now presenting 4% Advance & Decline script for TradingView.
Interpretation
The script calculates advances as the daily percentage change ≥ 4% divided by the total number of stocks.
Declines are calculated as the daily percentage change < -4% divided by the total number of stocks.
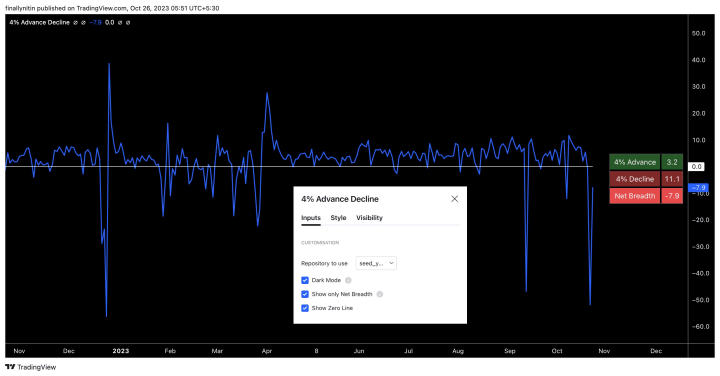
Net breadth is simply calculated by subtracting the declines from the advances. (4% up - 4% down).
Features
Dark Mode
Display only the net breadth
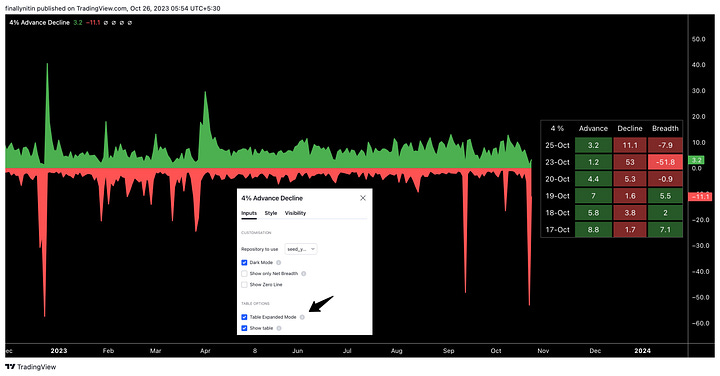
Expanded mode table for the past week
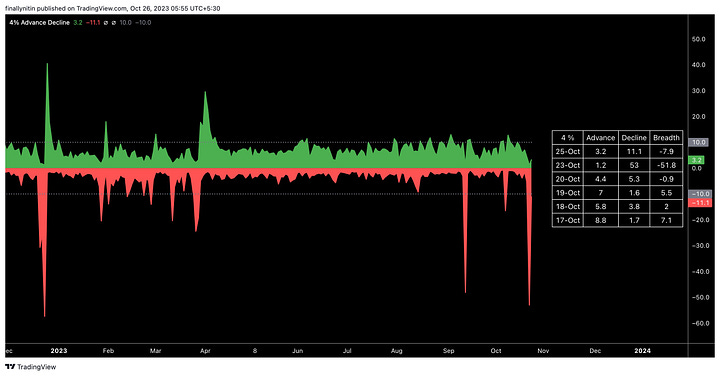
Plot 'comfort' levels' of +/- 10


Link
Here is the link to the 4% Advance & Decline for Tradingview:
Dependency
The script uses the Pine Seeds service to import custom data hosted in a GitHub repository and accesses it via TradingView as the frontend. So, the number of bars appearing on charts is fully dependent on the amount of historical data available. Any error or omission, if there, is a reflection of the hosted data, & not that of Tradingview.
Limitations
Such data has some limitations, like it can only be updated at EOD (End-of-Day), & only daily-based timeframes can be applied to such data. Irrespective of the intraday changes, only the last saved value on the chart is seen. So, it's best to use this script as EOD, rather than intraday. At the time of publication of this script, 375 days of historical data was available.
Credits
This script uses the NSE Market Breadth data from @swing_ka_sultan via a pine seed from @TheLogicalSwing. Hats off to these amazing individuals, without whose efforts, such scripts wouldn't have seen the light of this day!


Its loading data is valid until the 27th of December only, kindly check.
Thanks
Its loading data till 27th of December only, kindly check.
Thanks