


A hard-money environment with limited conventional breakout/pullback setups, many of which are close to their earnings release. After a one-way bull swing of the past month of April, this pullback here could help upswinging stocks form healthy constructive chart structures.
Aggressive swing portfolios are almost back in cash, while conservative swing portfolios are, as usual, still waiting for more quality setups to emerge in the coming days.
After the generous market of the past few weeks, we are back to basics, where sloppily entering anywhere is swiftly getting punished. Leaving aside a few stocks that are still showing urgency, most are in one or the other stage of a pullback. Some of these will collapse & totally give away most of the up move, but a good number of these are still poised to let the volatility settle down further, and provide low-risk entry points with a potential for decent upsides.
⦿ Bias: Bear
⦿ Trend: Uptrend
⦿ Swing: Upswing (under strain)
⦿ Momentum: Positive & Improving
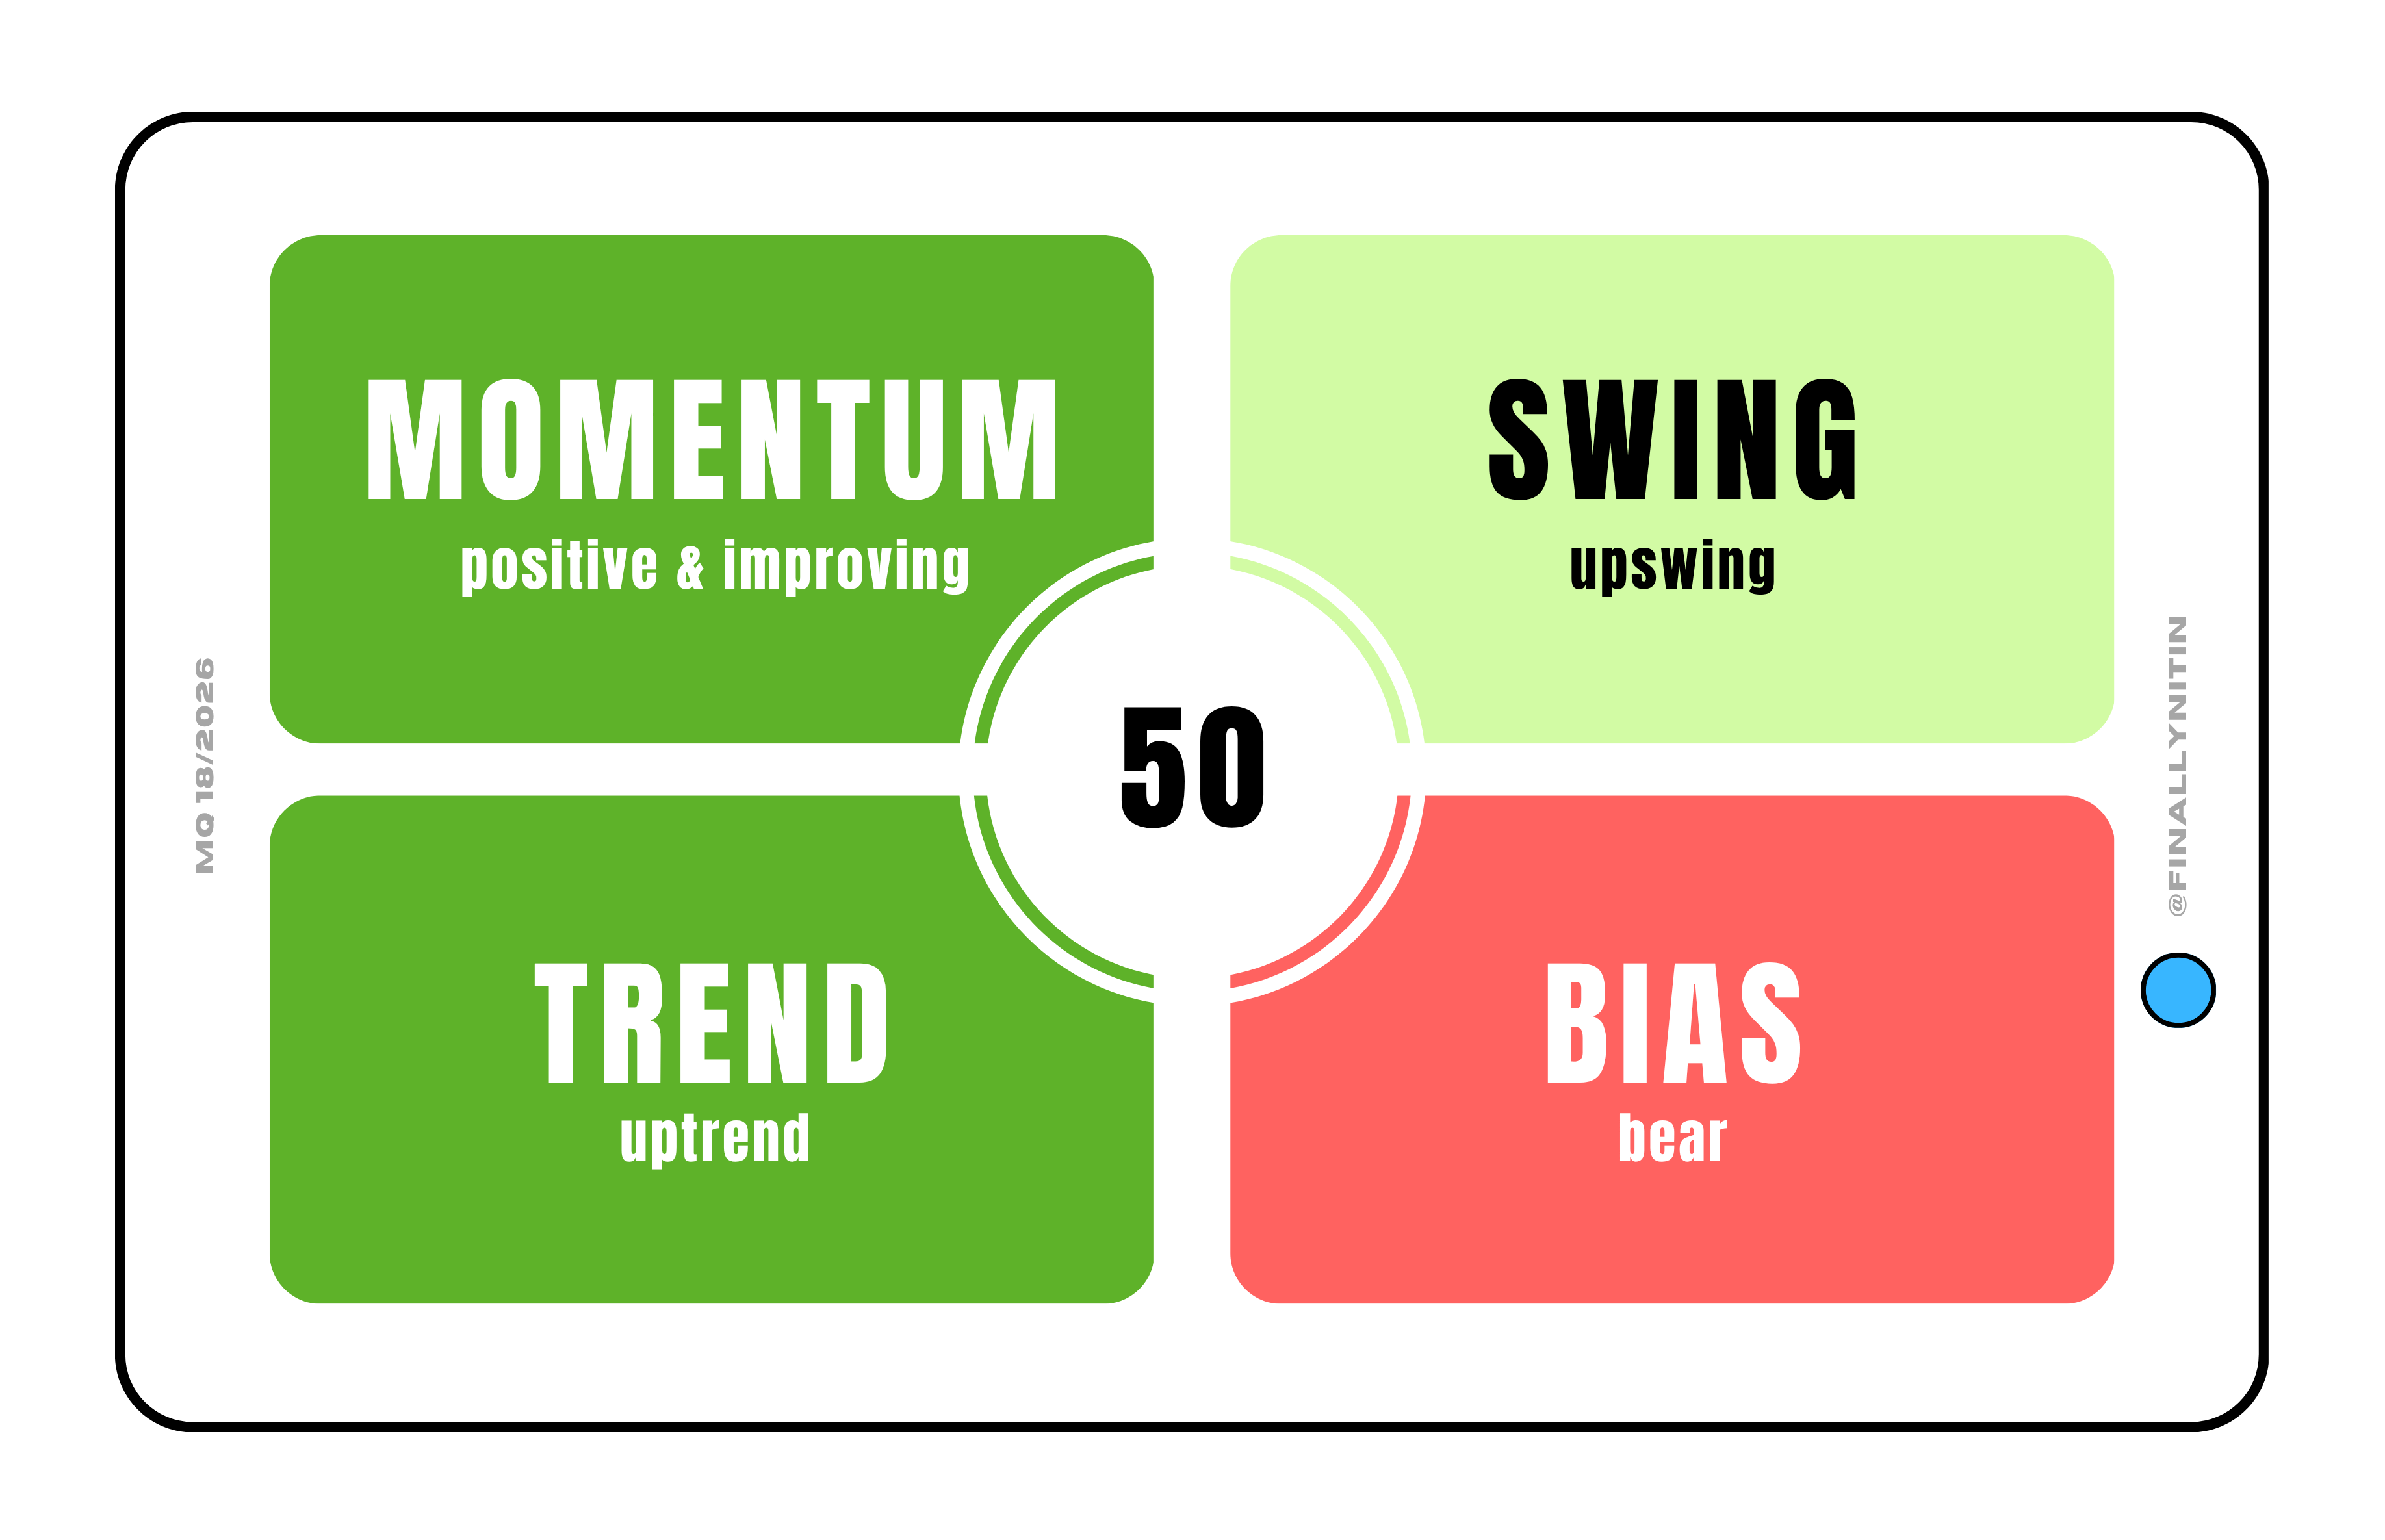
Bias → Bear
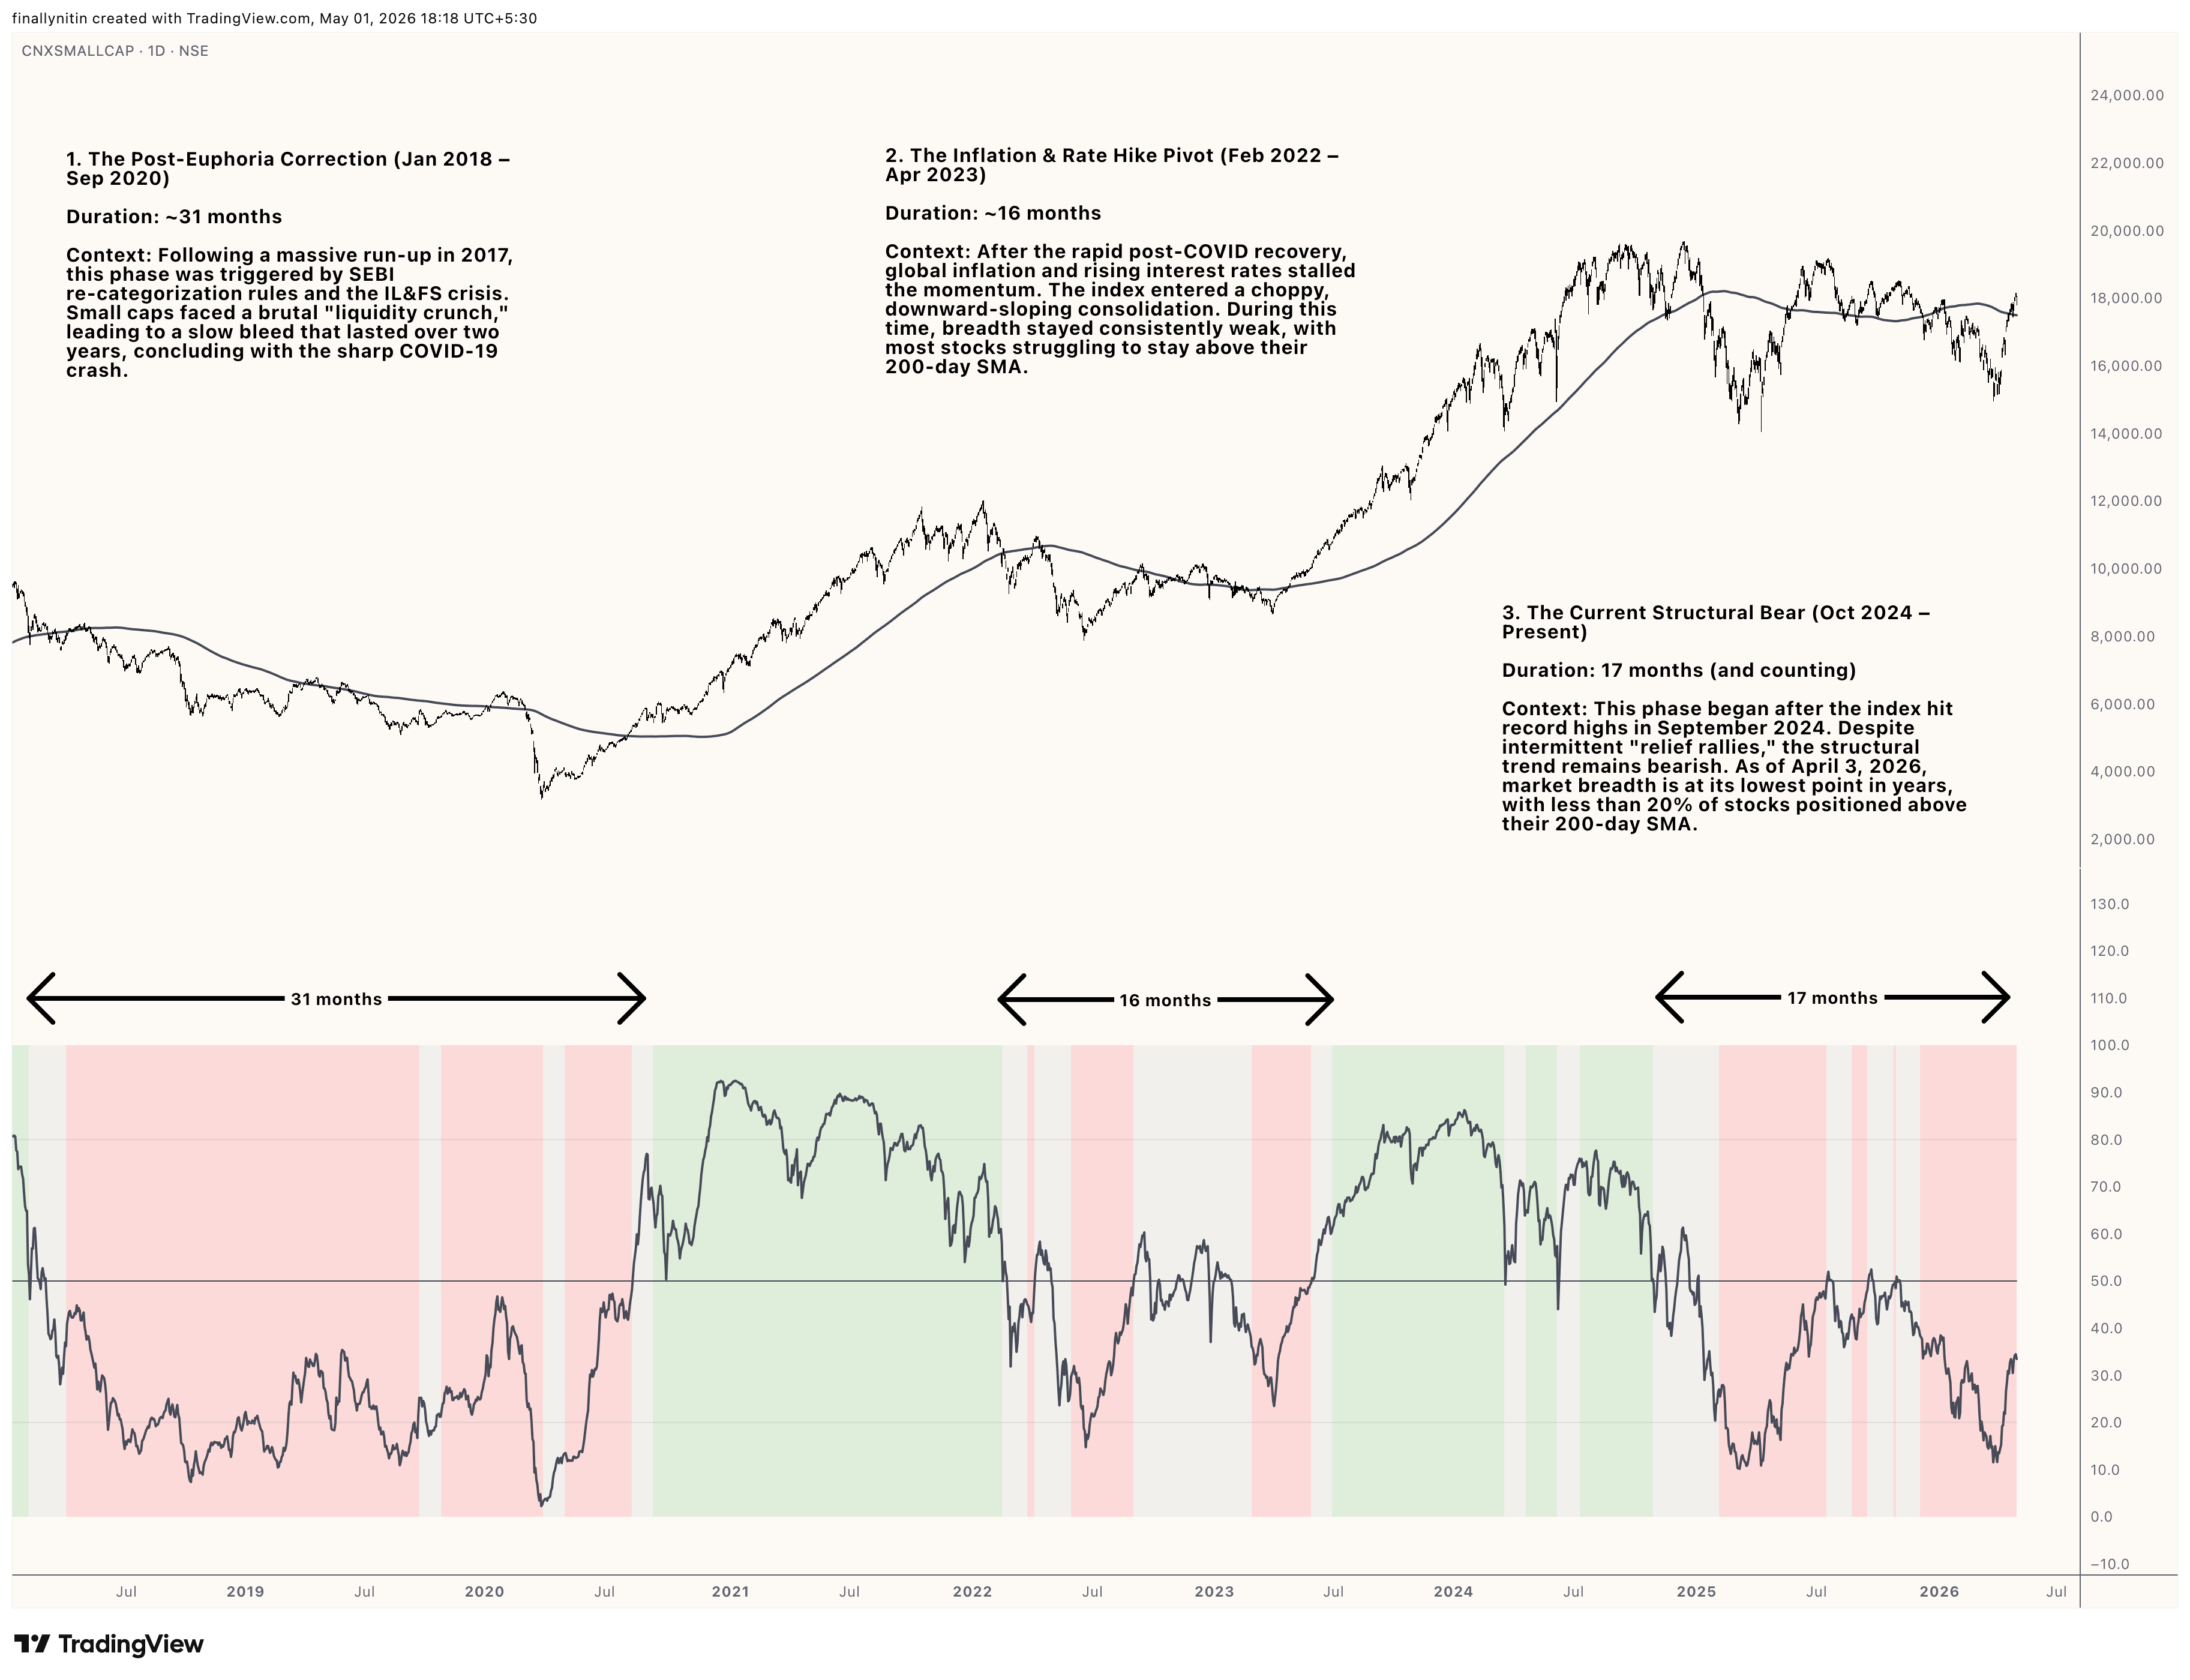
From a long-term perspective, we remain in a bear market.
Over the past month, more than 50% of stocks have remained below their 200-day simple moving average (SMA). Hence, we stay in a bear market.
About 33% of all stocks are positioned above their 200-day simple moving average. This week's numbers are better than those of last week's, but we remain well below the 50% mark.
When more than 50% of stocks go above their 200-day SMA, we will again enter a transitional market. If this percentage stays above 50 for a month, we will finally enter a bull market.
Indian markets have experienced three distinct bear phases since 2017: the Post-Euphoria Correction (31 months, 2018–2020), the Inflation & Rate Hike Pivot (16 months, 2022–2023), and the current Structural Bear (17+ months, Oct 2024–present). The current phase has already surpassed the 2022-23 correction, with less than 25% of stocks above their 200-day moving average.
Trend → Uptrend
The current market is in a confirmed uptrend.
The 52-week Net New Highs have remained consistently positive for the past three days. We are still in the early single digits, though.
Over the past three days, most broad indices stayed consistently above their 50-day moving averages. The Nifty 50 is still sideways with regard to its 50-day MA. About 75% of all stocks have remained above their 50-day MAs.
The market will stay in a confirmed uptrend till the 52-week highs consistently stay above the 52-week lows, PLUS more than 50% of stocks remain consistently above their 50-day moving averages.
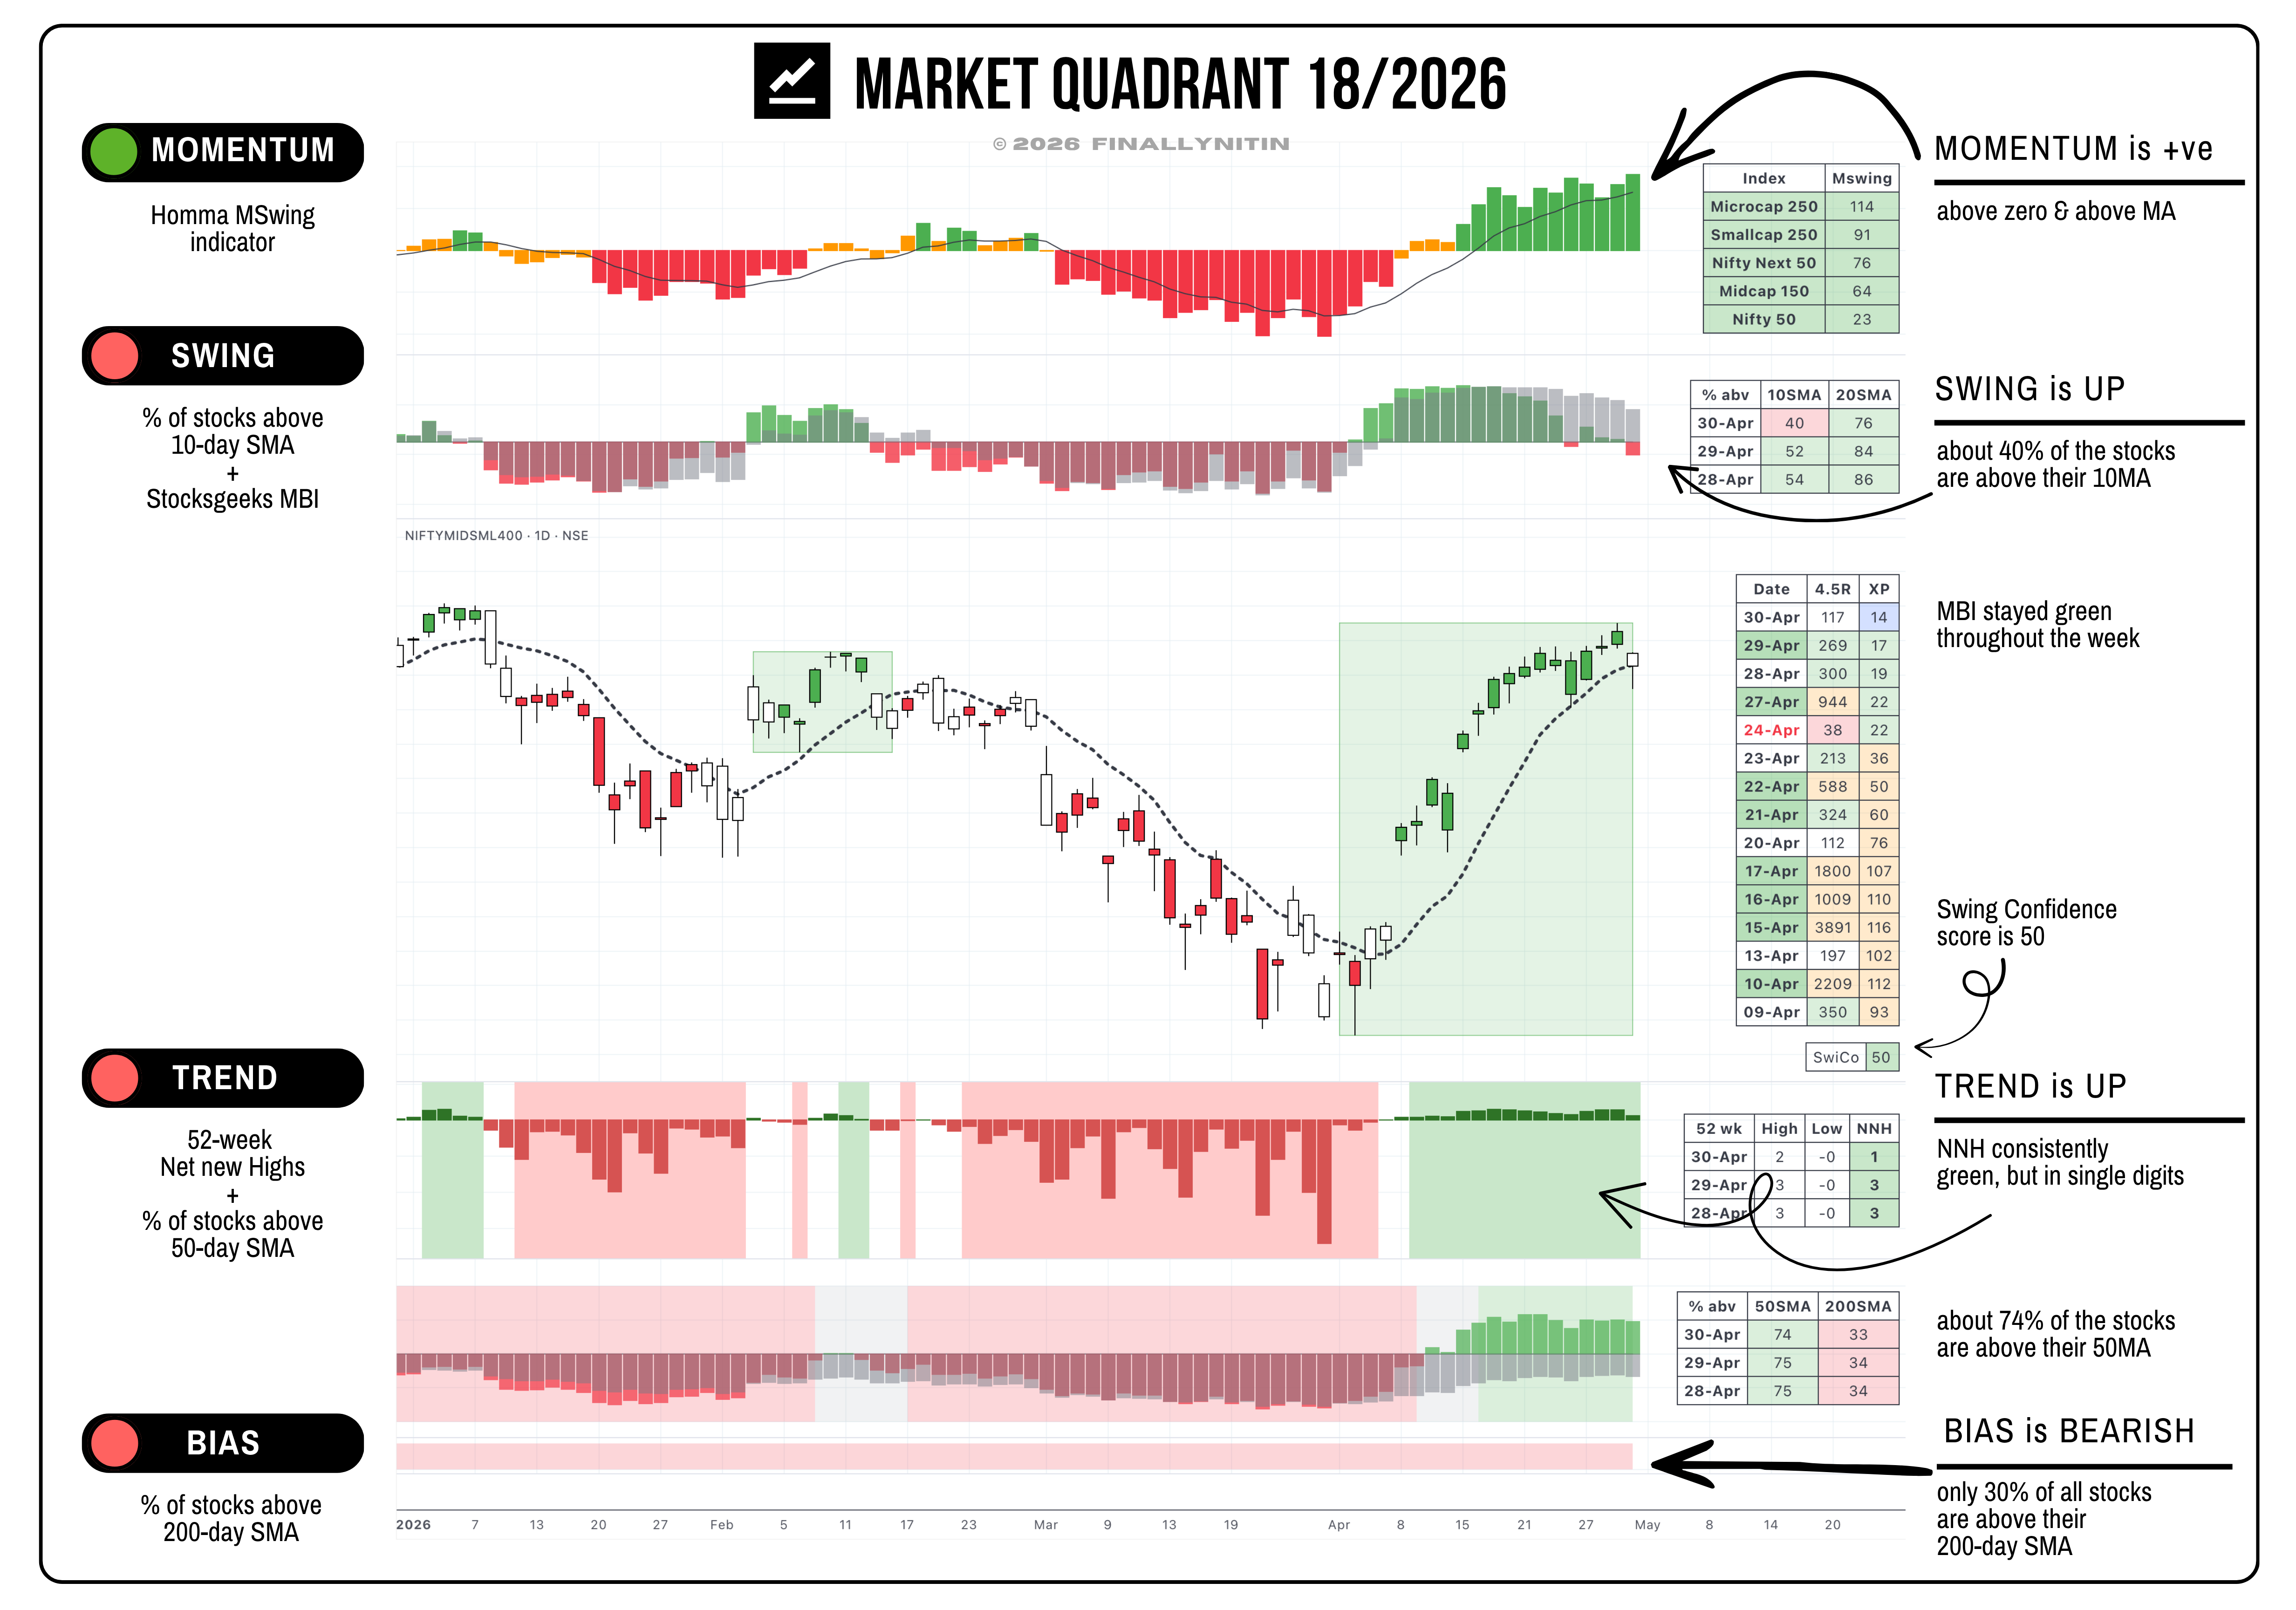
Swing → Upswing (under strain)
The market is in an upswing under strain.
While the MBI had closed last week with a warning day, it turned green again this week, although the 4.5R numbers were mostly below 400.
Only the Smallcap & Microcap indices are consistently above their 10-day MAs. Less than 40% of the stocks are trading above their 10-day moving averages, and, not favouring the bulls, the 10% breadth is below the 20% breadth.
Swing Confidence is 50, indicating that the portfolio can take half the maximum permissible open risk.
Momentum → Positive & improving
The overall market has positive & improving momentum, as the momentum score is above the zero line and its 9-period moving average.
Power/Energy, Defence, Capital market, Realty, Metals, Media, & Chemicals are the strongest indices at present.
IT & Railways are the only indices with negative momentum.
That’s all for this week. If you'd like to know when I publish something new, subscribe to my newsletter, and you'll receive the latest directly in your inbox.
Nitin bhai, how is swing confidence determined? also how does one calculate open risk of ones pf? Any formula or reading material available?