


We are witnessing worsening momentum in a downswing within a sideways transitional market.
A hard-money environment with stock-specific follow-throughs. Conservative portfolios should either be in all-cash or hold relatively strong stocks with no open risk.
⦿ Bias: Transitional
⦿ Trend: Sideways
⦿ Swing: Downswing
⦿ Momentum: Negative & worsening
Bias → Transitional
From a long-term perspective, we are now in a transitional phase.
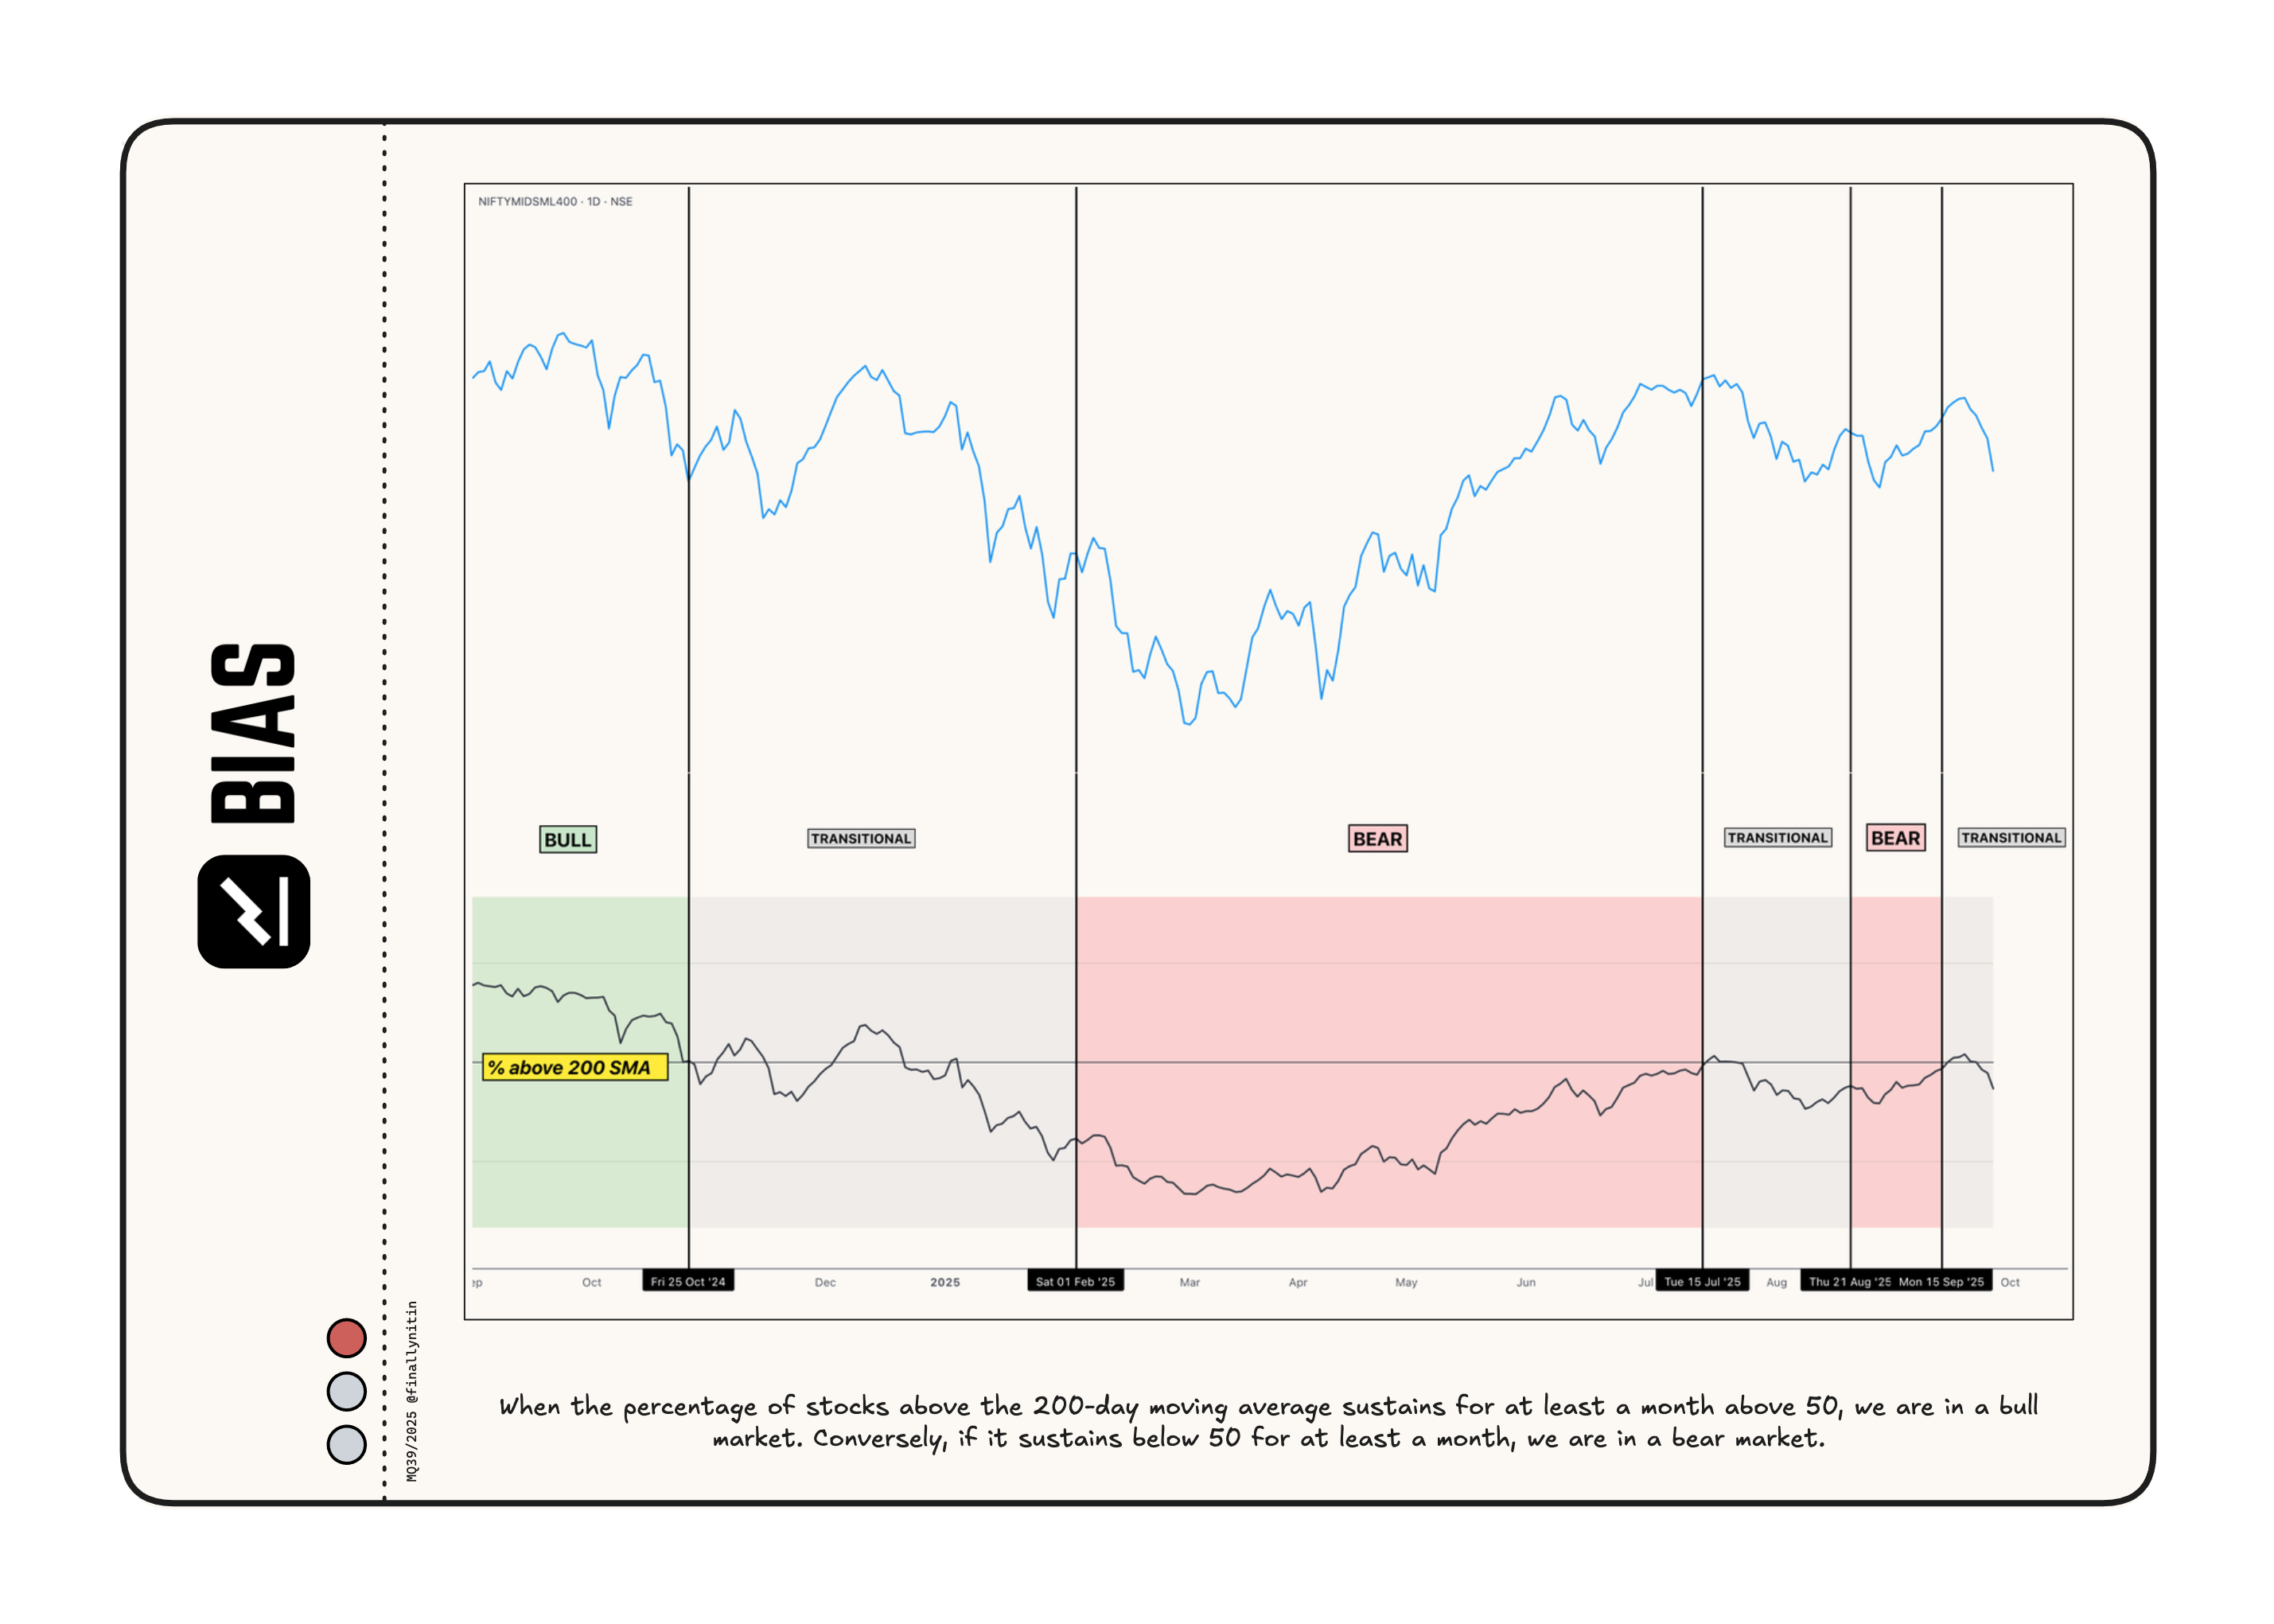
After staying below the 200-day simple moving average (SMA) for 7 weeks, more than 50% of the stocks moved up the 200 SMA last week, and the market entered a bear-to-bull transitional phase. This week, more than 50% of the stocks have stayed below their 200 SMA.
About 42% of stocks are positioned above their 200-day simple moving average. This is a downgrade from last week.
When the percentage of stocks above the 200-day SMA remains above 50 for at least a month, we will be in a bull market. If, instead, it stays below 50 for a month, we will return to a bear market.
Trend → Sideways
After staying in an uptrend for the past 3 weeks, the market trend can now be described as sideways.
52-week Net New Highs have not remained consistently positive or negative for the past three days. One more negative day will turn the NNH red.
Over the past three days, major indices have not remained consistently above/below their 50-day moving averages, with approximately 30% of all stocks remaining above their 50-day moving averages.
The market will enter a confirmed downtrend if the 52-week highs consistently remain below the 52-week lows and less than 50% of stocks stay above their 50-day moving averages.

Swing → Downswing
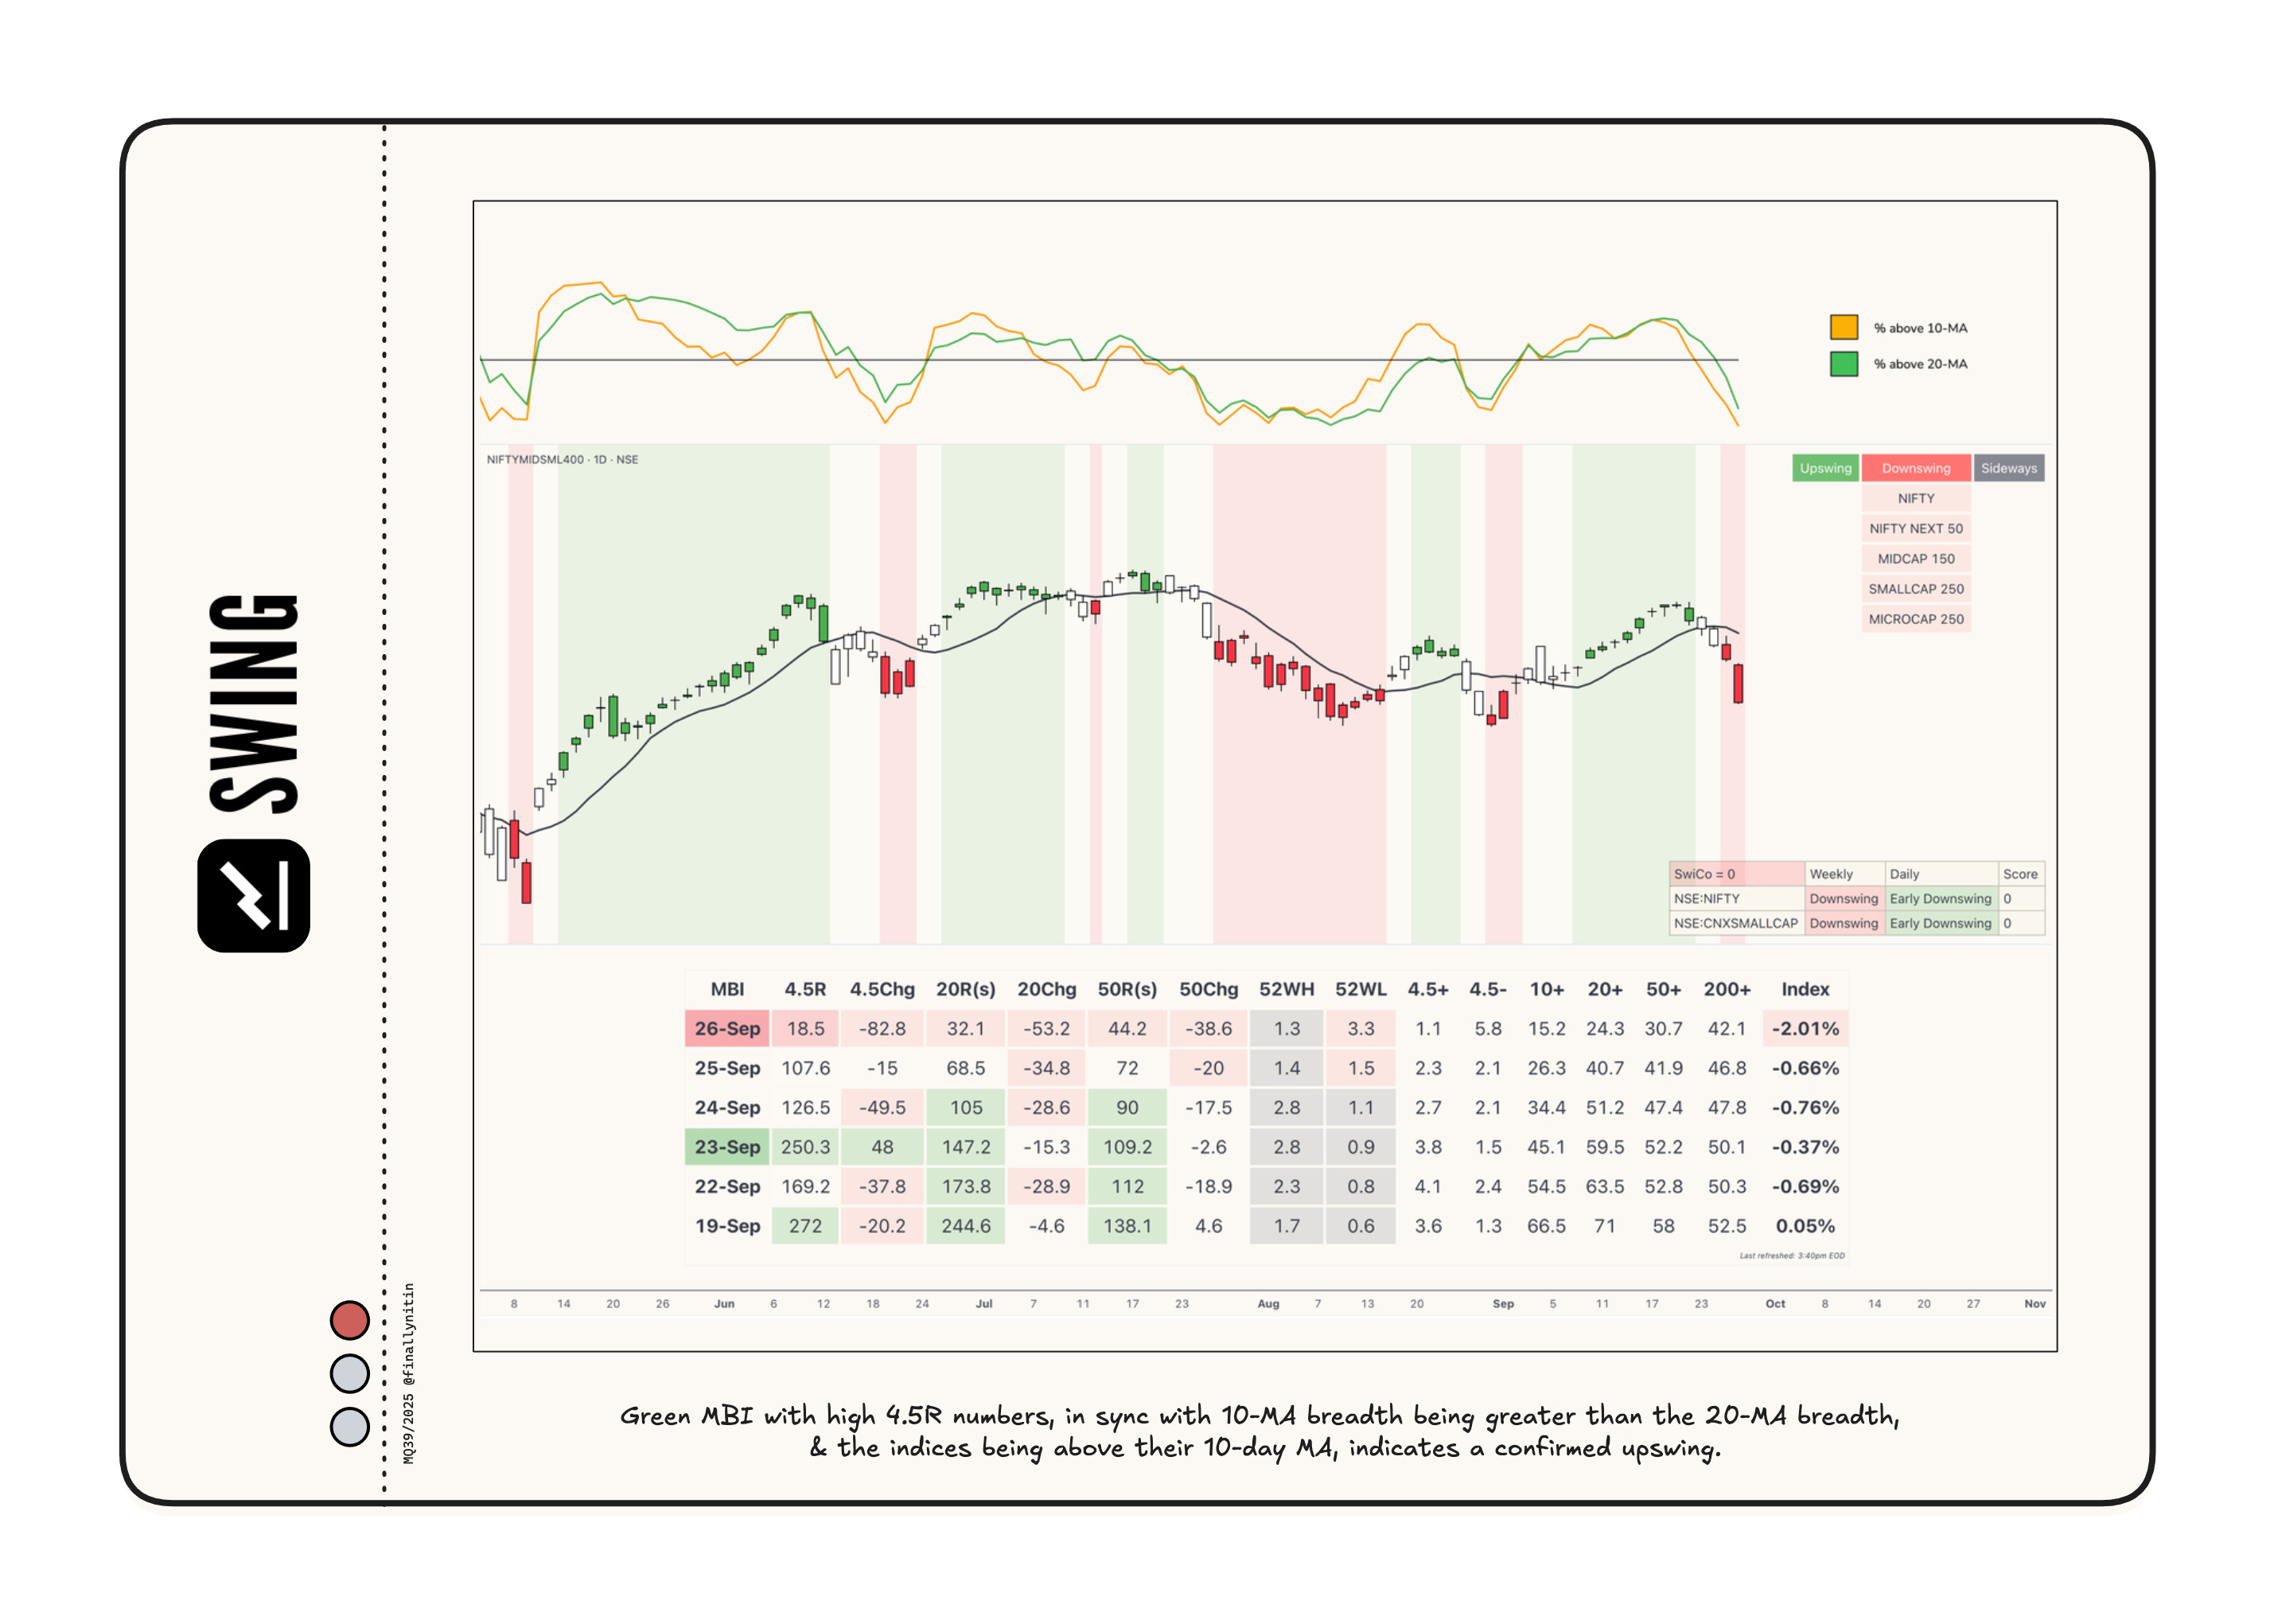
After a brief (and half-hearted) upswing that lasted only two weeks, we are now experiencing a downswing, as Stocksgeeks MBI has turned red, and the indices are well below their 10-day moving averages.
The MBI barely managed to stay green throughout this week, and finally ended the week in the red.
All broad indices remained consistently below their 10-day moving averages. Approximately 15% of stocks are trading above their 10-day moving averages, and, not favoring the bulls, the 10% breadth has stayed below the 20% breadth. We are nearing oversold levels on very short-term timeframes.
Swing Confidence is 0, indicating that the portfolio should not take on any open risk.
Momentum → Negative & worsening
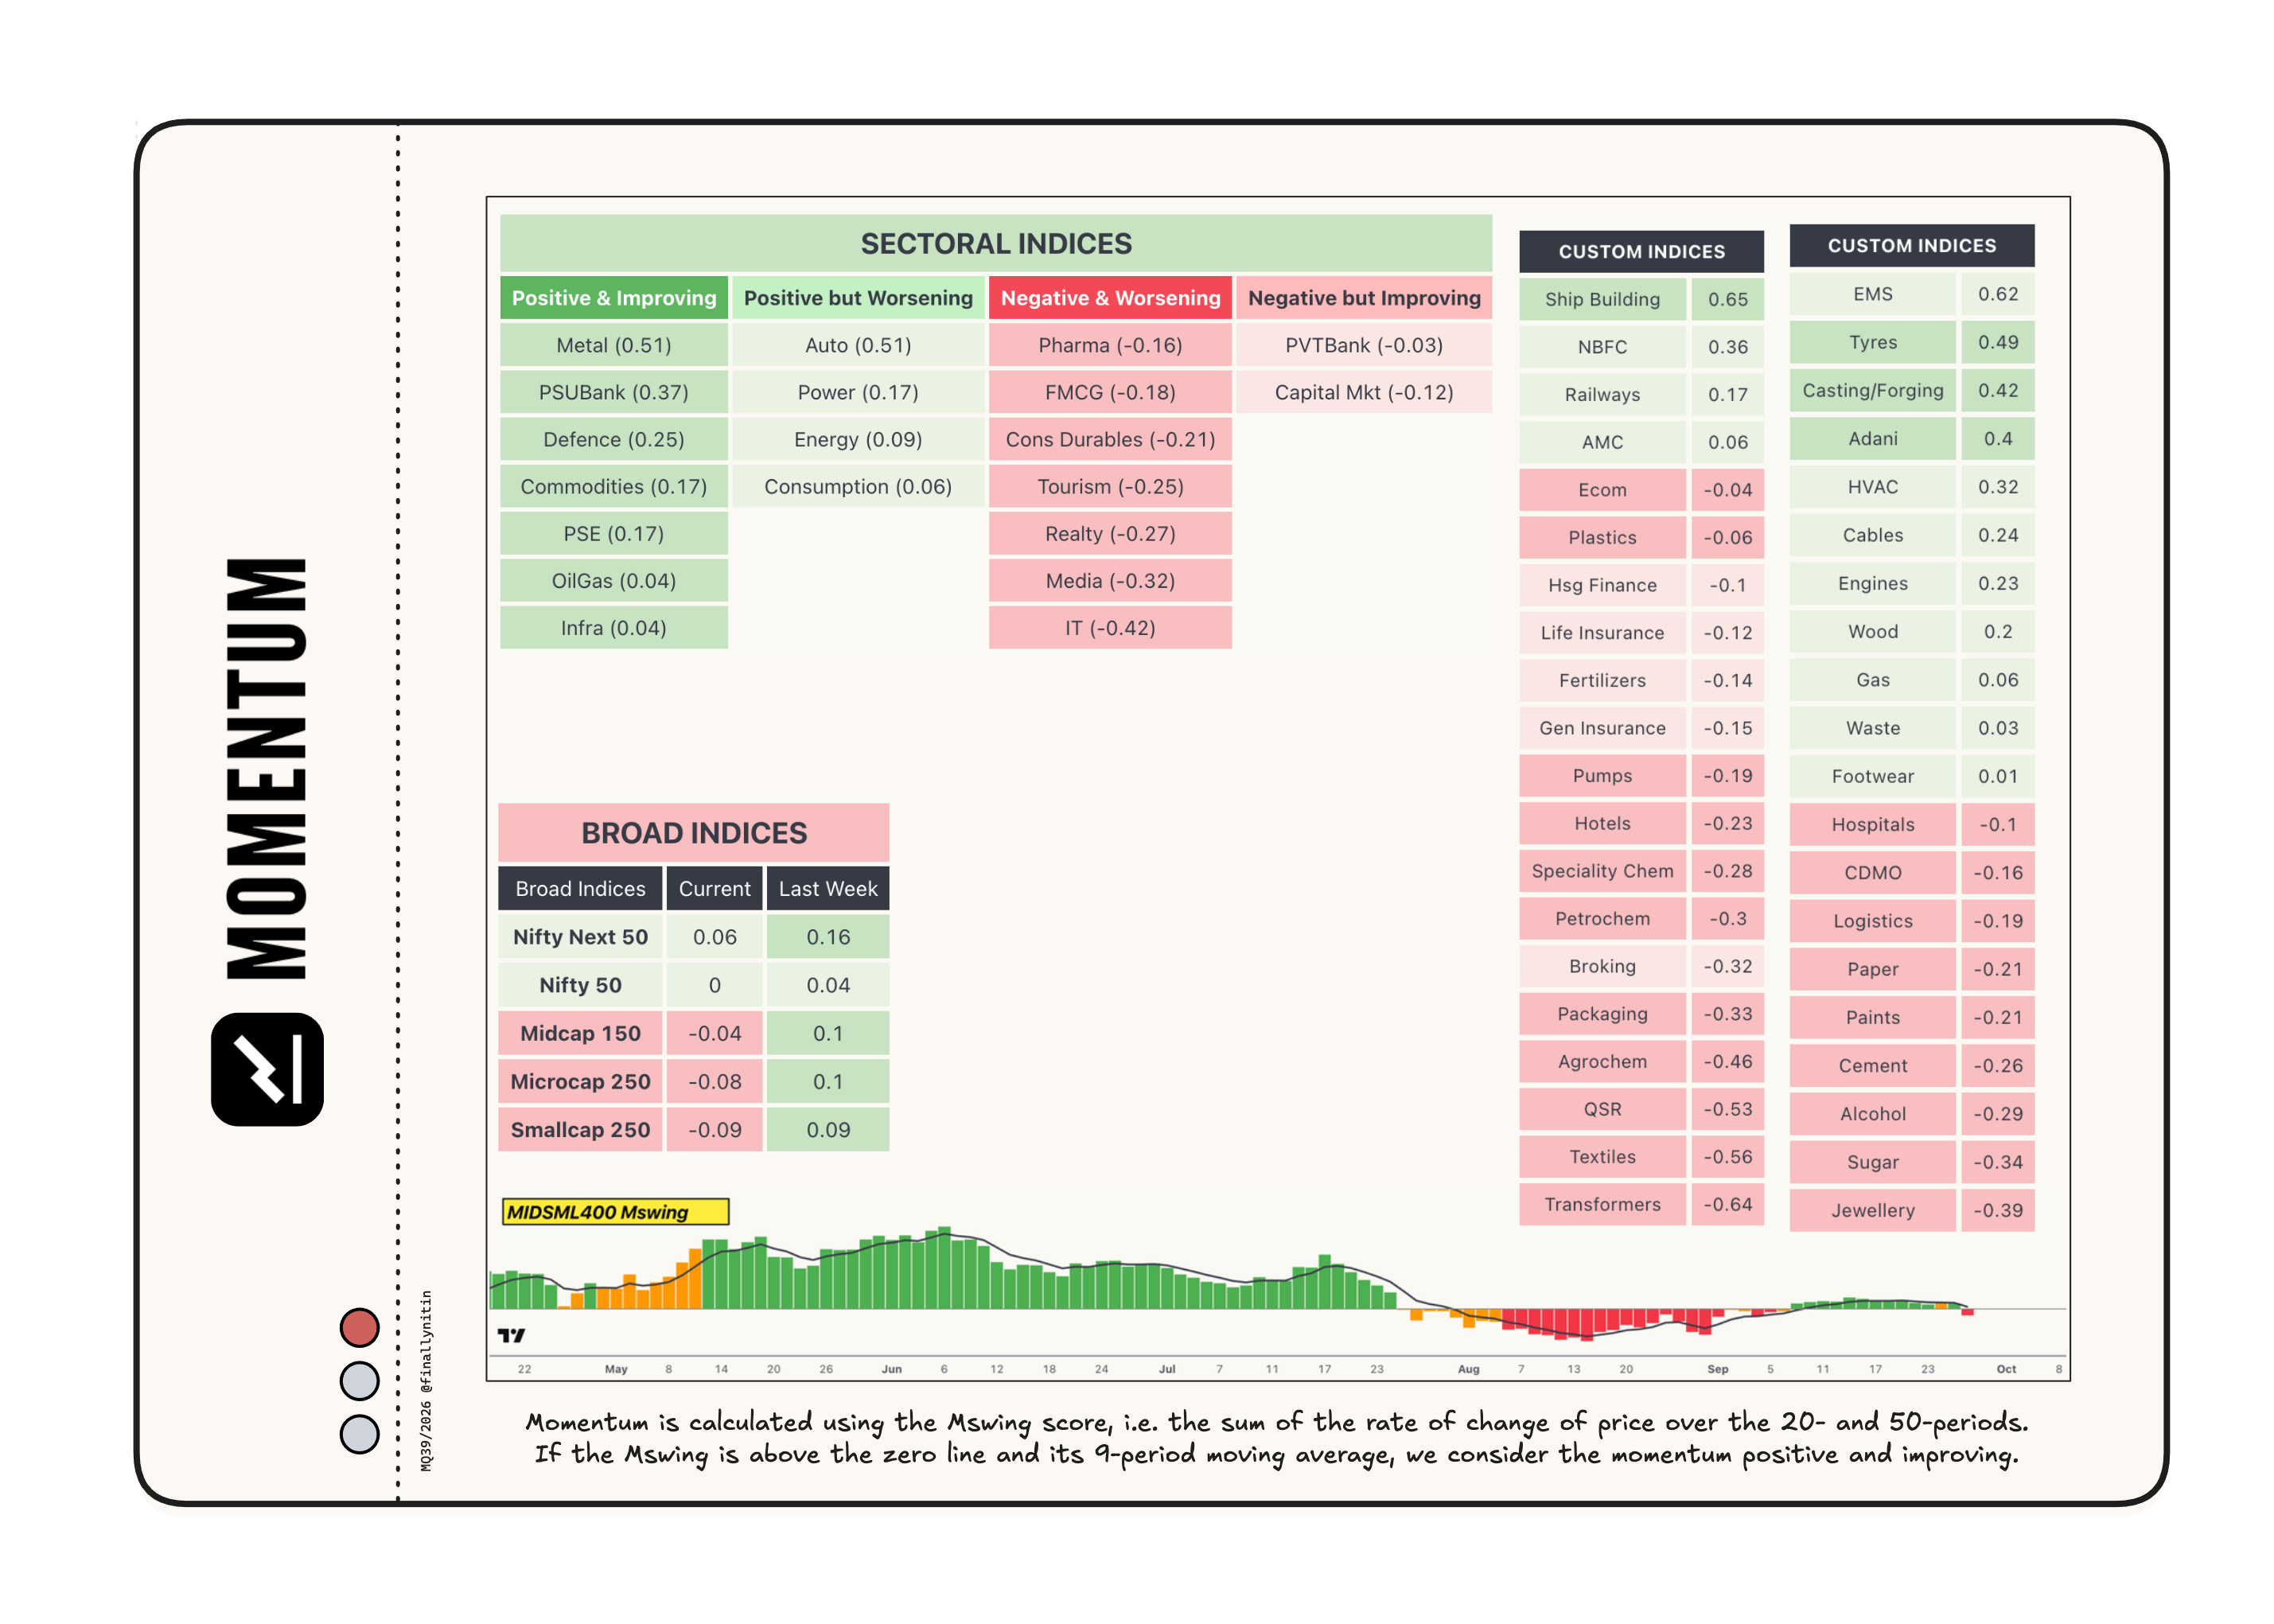
Most broad indices now have negative & worsening momentum, as the momentum score is below the zero line and its 9-period moving average.
Most sectoral indices also exhibit negative & worsening momentum. Metal, PSUbank, Defence, Commodities, and PSE have positive & improving momentum.
Shipbuilding, NBFC, EMS, Tyres, and Casting/forging are notable custom indices with positive momentum.
That’s all for this week. If you'd like to know when I publish something new, subscribe to my newsletter, and you'll receive the latest directly in your inbox.
How can i use this model for us market? Can you explain more about stockgeek’s swing model?
Nitin sir, why you do not use the ADX for market trend strength ? Any shortcomings on that method?