

Moving Average Relative Strength (MARS)
TradingView script

Tough times call for tougher measures.
Here's my take on relative strength using a simple moving average, some cricketing analogies & a Tradingview script.
What is MARS?
MARS stands for Moving Average Relative Strength.
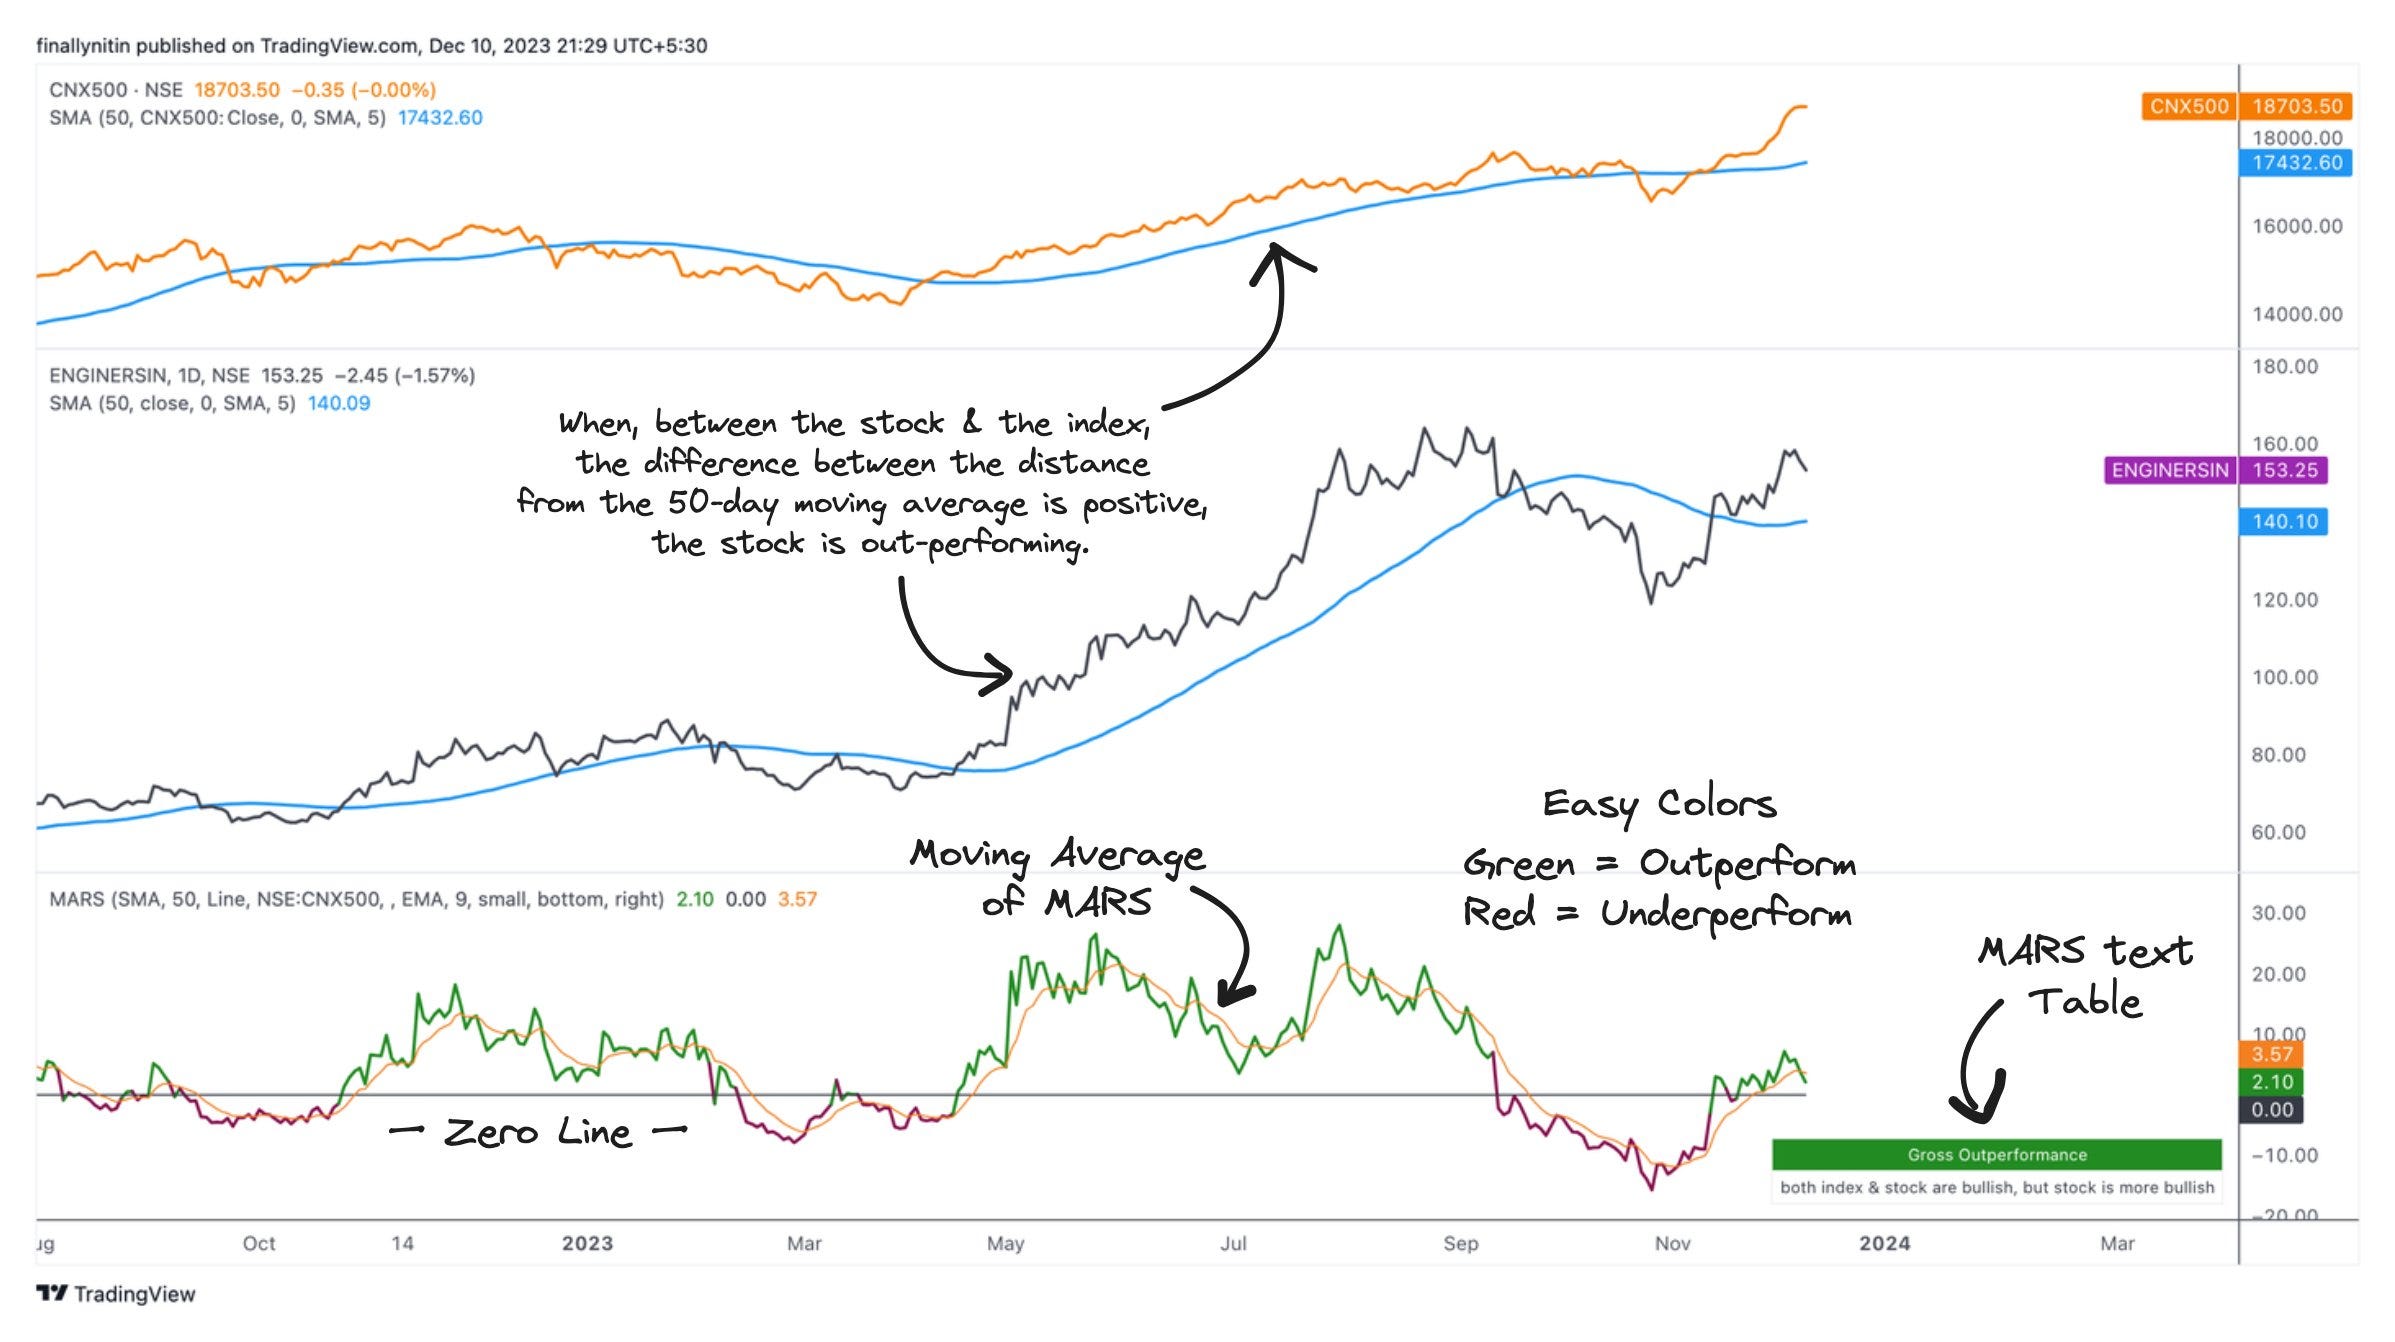
We compare the distance from 50-day moving average of the stock vs that of the index. Whomsoever of the 2 has a greater value is stronger.
The length of the moving average is customisable as per your time-horizon.

The basic structure of the script
Background color indicates the index being above or below its moving average.
Blue: index above its MA
Pink: index below its MA
Histogram indicates whether the stock is under-performing or out-performing the index.
- Up-bars: out-performing
- Down-bars: under-performing

Outperformance
When, between the stock & the index, the difference between the distance to/from the 50-day moving average is positive, the stock is out-performing.
This outperformance can be of 3 types:
⦿ Relative
⦿ Absolute
⦿ Gross
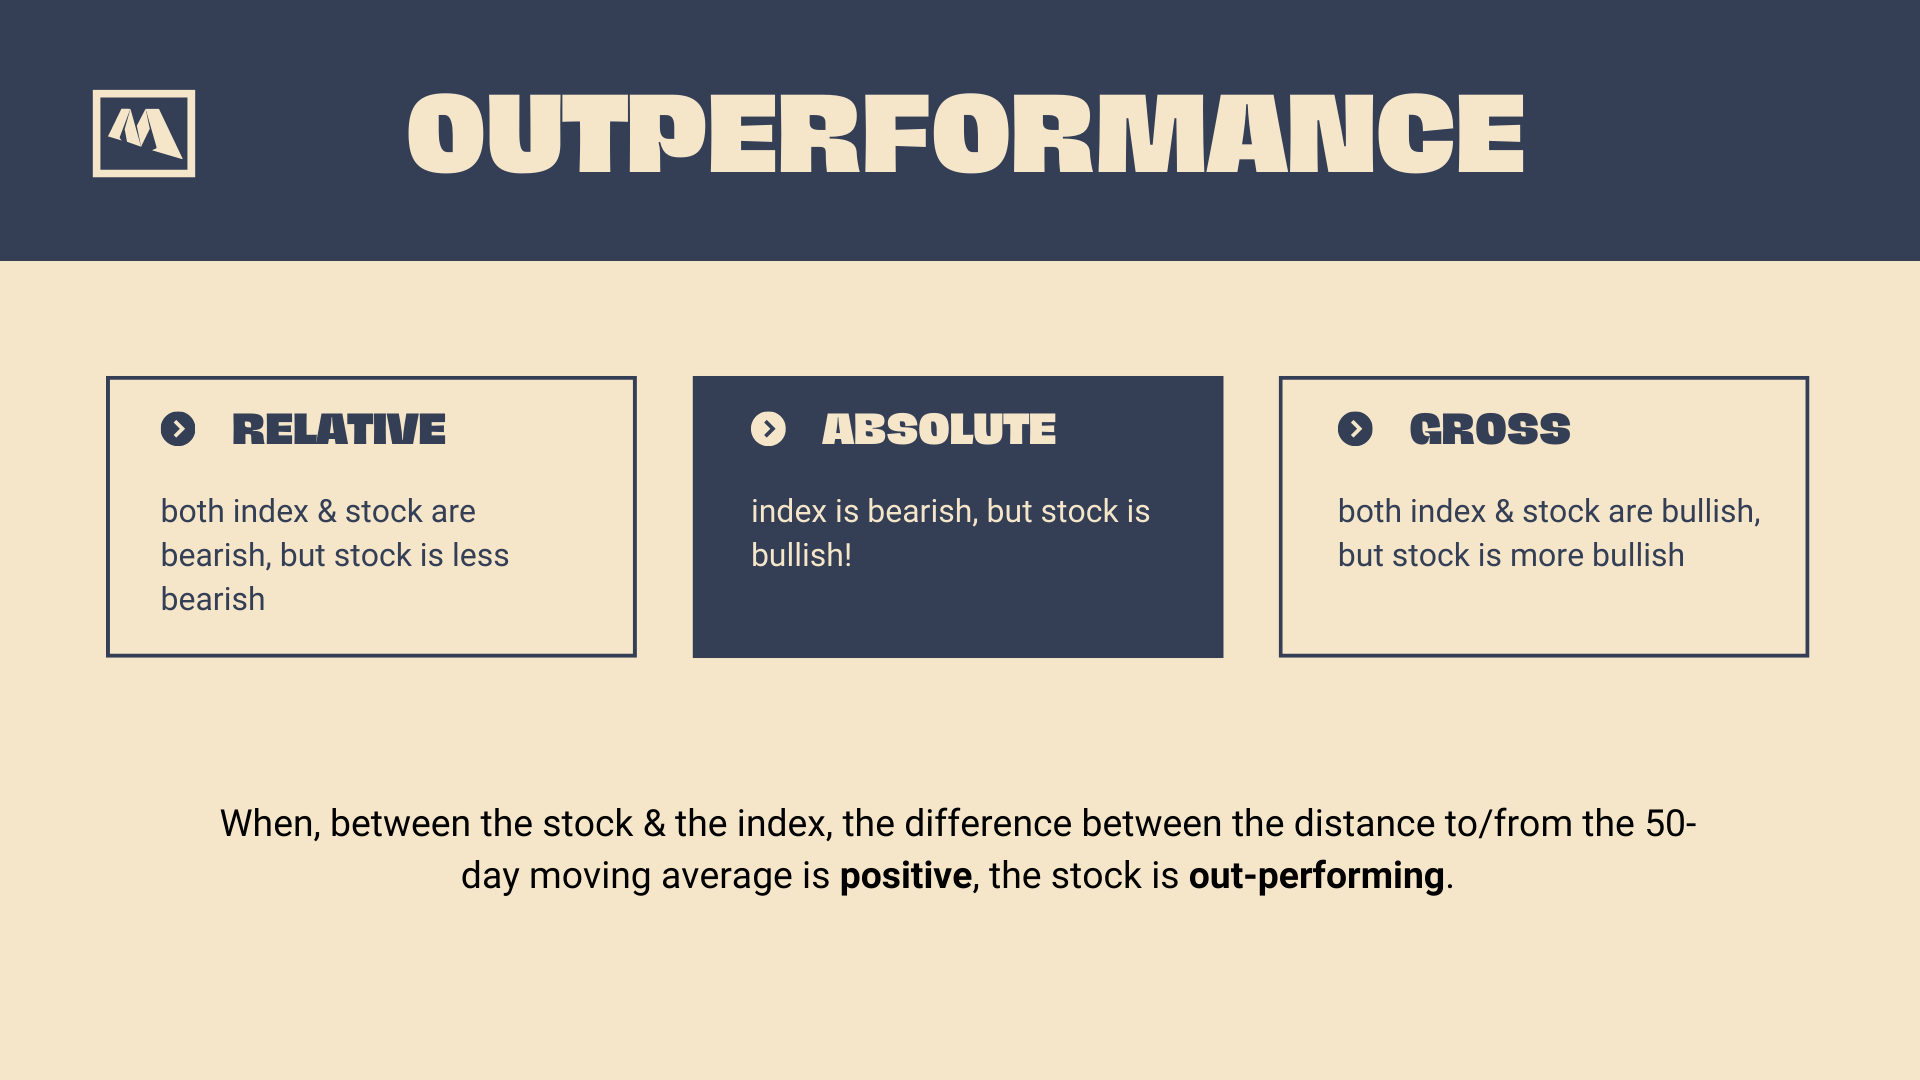
Absolute Outperformance
Batting conditions are tough. Sachin has made just 25 runs (bearish), but Kohli has easily made 60 runs (bullish).
The index is bearish, but the stock is bullish.
The script prints blue up-bars on a pink background.

Gross Outperformance
Batting conditions are easy. Sachin has made 55 runs (bullish), but Kohli has made 65 runs (bullish).
Both index & stock are bullish, but stock is more bullish
The script prints green up-bars on a blue background.

Relative Outperformance
Batting conditions are tough. Sachin has made 20 runs (bearish), but Kohli has made 35 runs (less bearish).
Both index & stock are bearish, but stock is less bearish
The script prints light green up-bars on a pink background.


Underperformance
When, between the stock & the index, the difference between the distance to/from the 50-day moving average is negative, the stock is under-performing.
This underperformance can be of 3 types:
⦿ Relative
⦿ Absolute
⦿ Gross

Absolute Underperformance
Batting conditions are easy. Sachin has already made 70 runs (bullish), but Kohli has only made 25 runs (bearish).
The index is bullish, but the stock is bearish.
The script prints black down-bars on a blue background.

Gross Underperformance
Batting conditions are tough. Sachin has made 35 runs (bearish), but Kohli has made only 20 runs (more bearish).
Both index & stock are bearish, but stock is more bearish
The script prints dark red down-bars on a pink background.

Relative Underperformance
Batting conditions are easy. Sachin has made 80 runs (bullish), but Kohli has made 55 runs (less bullish).
Both index & stock are bullish, but stock is less bullish
The script prints light red down-bars on a blue background.

Additional customisation options:
Paint bars option changes the bar colors to mirror the histogram colors.
Easy colors option just changes the histogram colors to either blue or pink, indicating out-performance or under-performance, respectively. This is when the trader does not wish to demarcate between the above-mentioned 6 conditions.
Conclusion
In a nutshell, we would love Absolute Outperformance, & totally stay away from Absolute Underperformance.

Resources
Update
Default plot display is now a line style, instead of the previous histogram style. This is still user-customisable.
Moving average for smoothing of MARS is now incorporated. By default, it uses a 9 EMA of MARS. If the MARS stays above its moving average, it indicates that MARS is going up, & is a bullish sign.
Text description of the current relative strength state is visible as a table. It is a verbose table by default (with details of the current MARS state). You can turn-off the detailed text or even hide the entire table altogether.
Easy color mode is turned on by default. Easy colors are now really 'easy', as the out-performing & under-performing colors are now represented by green & red, respectively.
Hope you find this useful.
Thank you for sharing your insights and have learnt something great from this article.
When I was trying to understand the conclusion, I found something wrong with the metric.
When the condition(2nd Row and 2nd Column) is "stock > 50-day < index" and "index > 50-day (bullish market) then it should be "Gross Out-Performance" instead of "Relative Under-Performance". In addition to that, putting ""Relative Under-Performance" category in the metric would be very difficult.
This is my analysis on your conclusion. I could be totally wrong.