Presenting the Net New Highs Chartink dashboard!
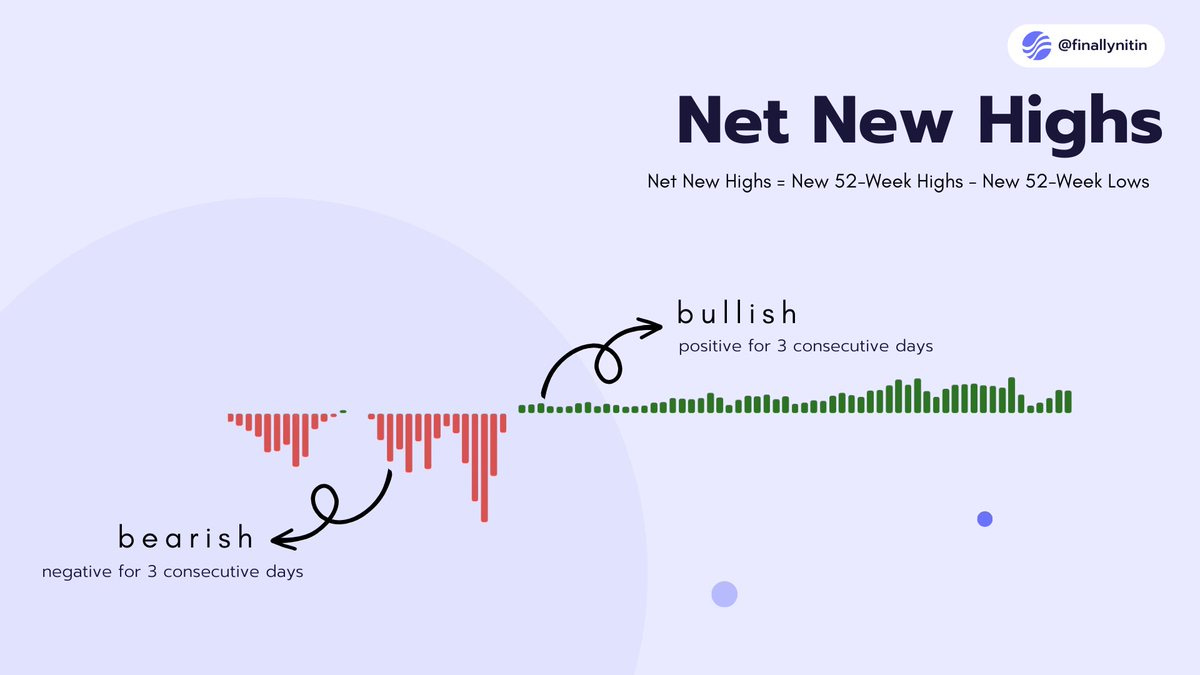
Net New Highs are calculated by taking the number of new 52-week highs on any given day and subtracting from it the number of new 52-week lows. We consider the bias as positive (bullish) when NNH stays positive for 3 consecutive days, & negative (bullish) when NNH stays negative for 3 consecutive days.
NNH based on New 52-week highs & lows are said to often lag the underlying market. Just like 52-week NNH, we can have NNH for 1 month, 3 months (1 quarter), & so on. These can give earlier signals, as the cost of being more noisy.
Yearly (52-week) NNH → Long-term bias
Quarterly NNH → intermediate bias
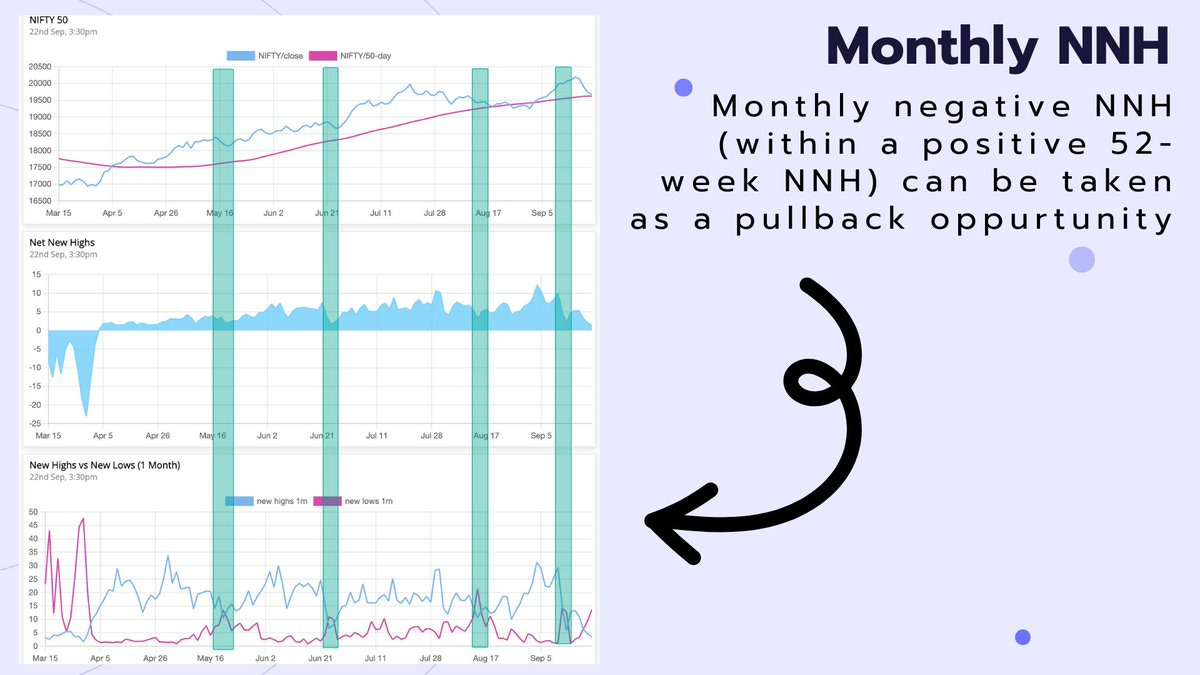
Monthly NNH → Short-term bias
One way of interpreting MTF NNH can be to view quarterly or monthly NNH as pullback opportunities. If the 52 week NH-NL is consistently positive, but the monthly NNH goes negative, it signifies a phase of correction or pullback. When the monthly NNH becomes positive again, it signifies the resumption of the bullish move.
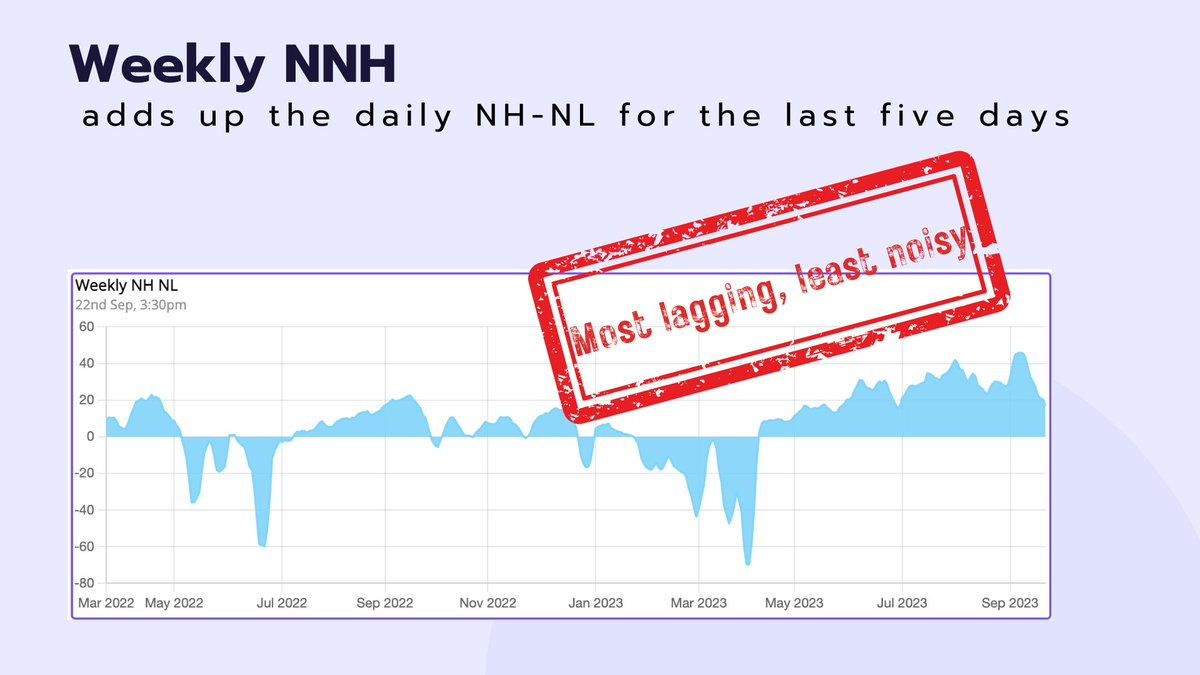
We can also choose to analyse the NNH on an even higher timeframe by looking at the Weekly NNH, which simply sums up the daily NH-NL for the last five days. This give the most confirmed signals, while lagging behind all the other NNHs.
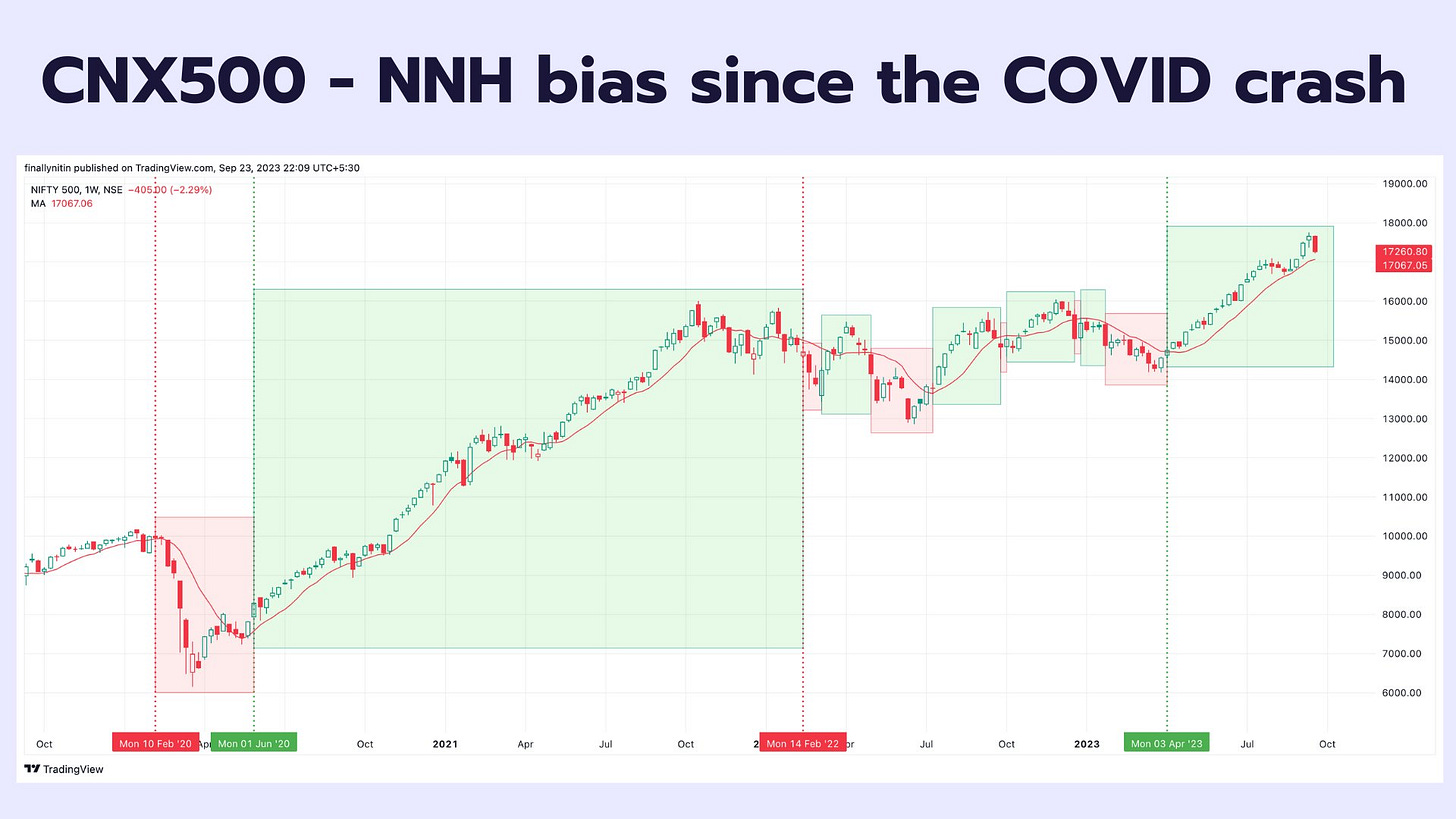
As long-only swing traders, we should participate in the market only when, among other things, the NNH bias is bullish. Just a combination of a positive NNH, combined with the indices staying above their 10-week (or 50-day) MA can keep one out of a lot of turbulent times.
Here is the link for the Net New Highs Chartink dashboard.


