

Pivot High Low Duo
Tradingview Script

Here is the Pivot High Low Duo script for Tradingview.
This is just an extension of the built-in Pivot Points High Low script.
Here it plots both 10-period & 20-period pivots in one script. All 20-period pivots will be 10-period pivots, so it avoids some clutter. Additionally, there is an option to show only the 10-period, or the 20-period pivots.
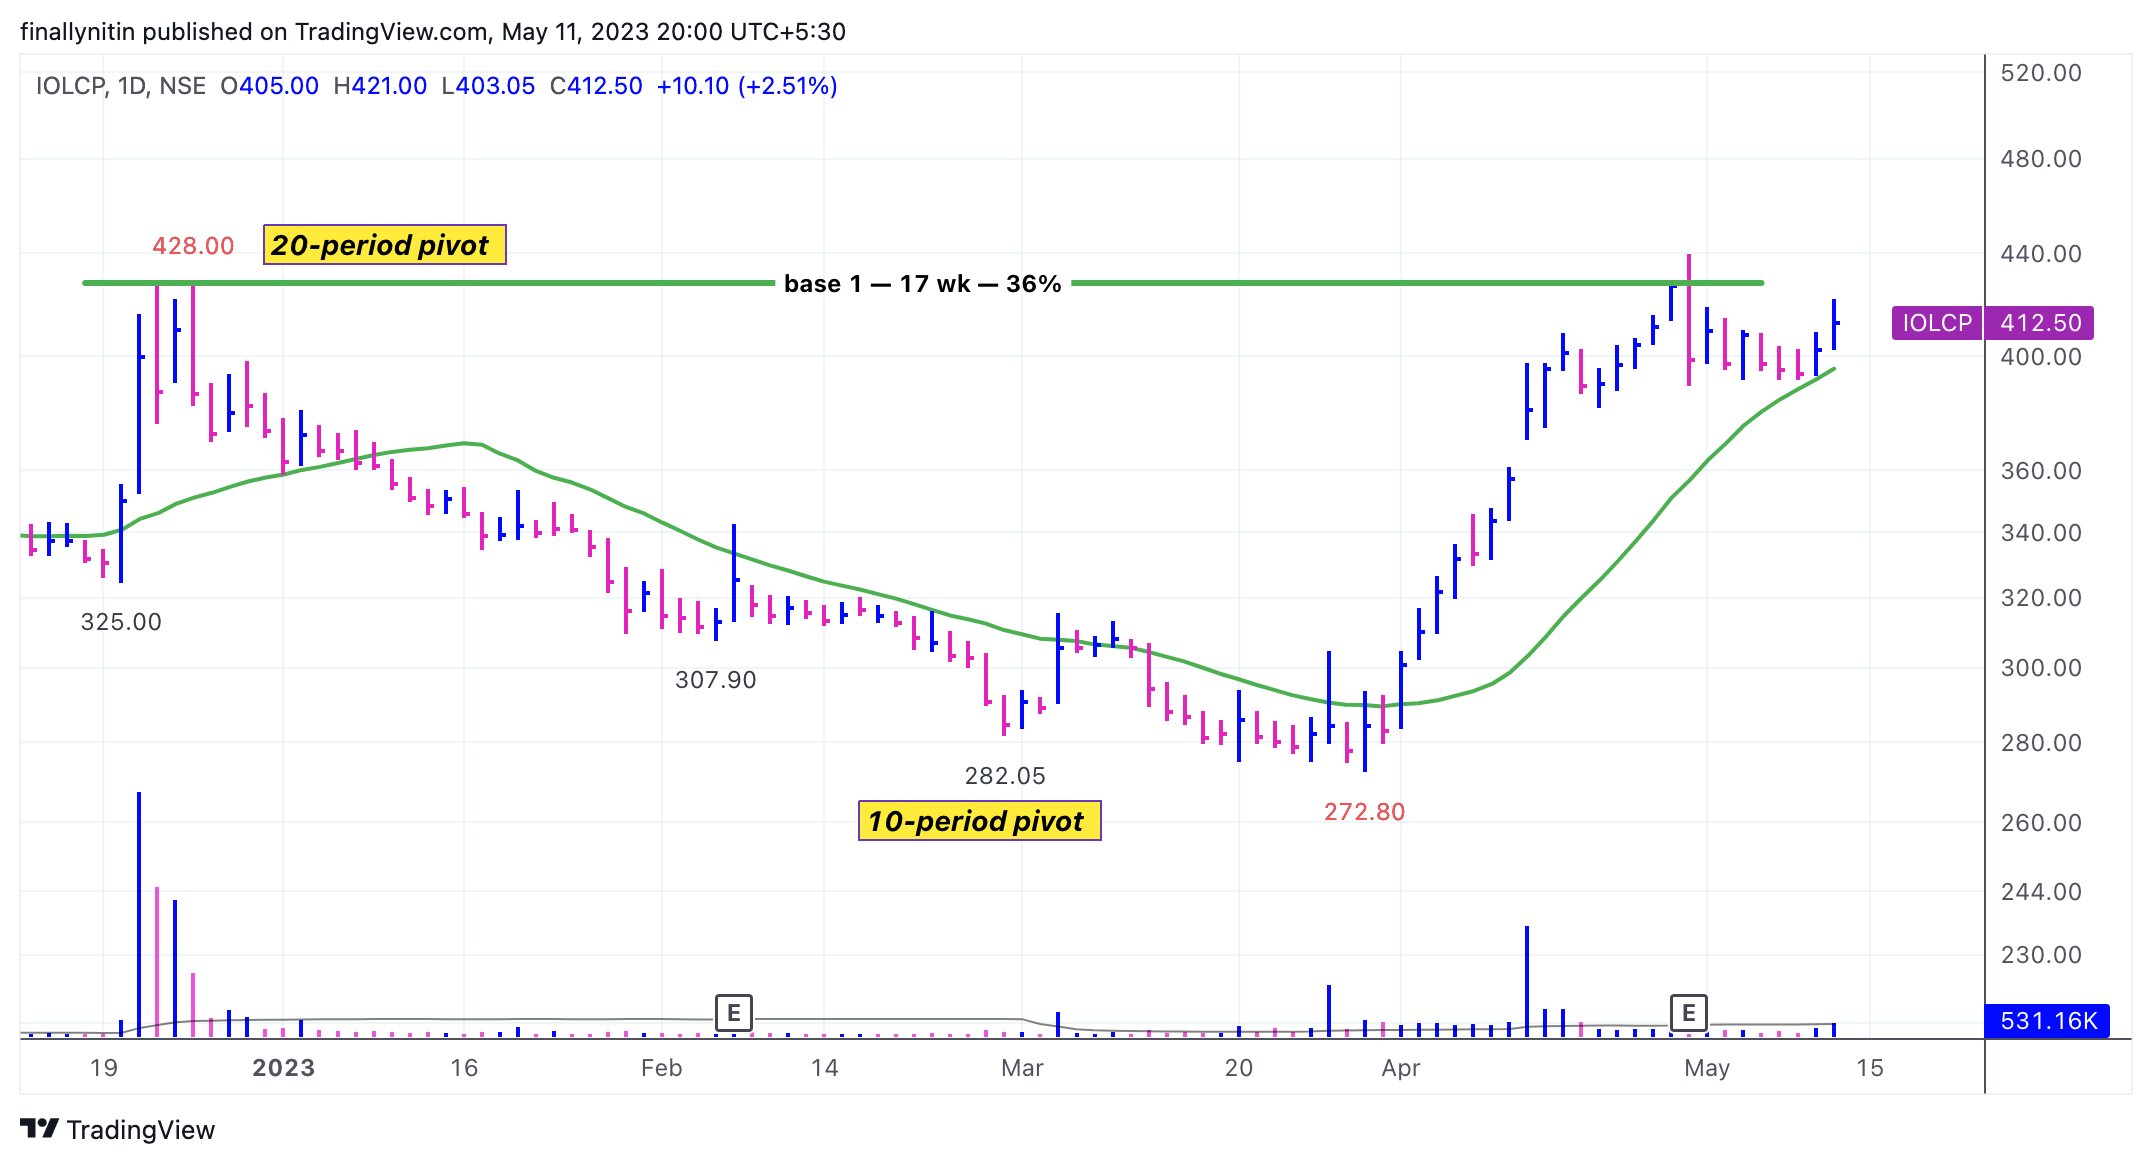
The basic concept is that if the high (or the low) is not crossed for next 20 bars, then the 20-period (or the 10-period) pivot high (or low) is formed.
I found these helpful in determining major price points, swing highs, & drawing horizontal lines for base counting.
For people following Elliot waves, Pivot high & lows can also help one can label wave counts easily. Himanshu has done a wonderful video on this:
How To Count Elliott Waves in 10 Seconds
Here is the link for Pivot High Low Duo script for Tradingview: