

Pocket Pivot Scan
Chartink scan

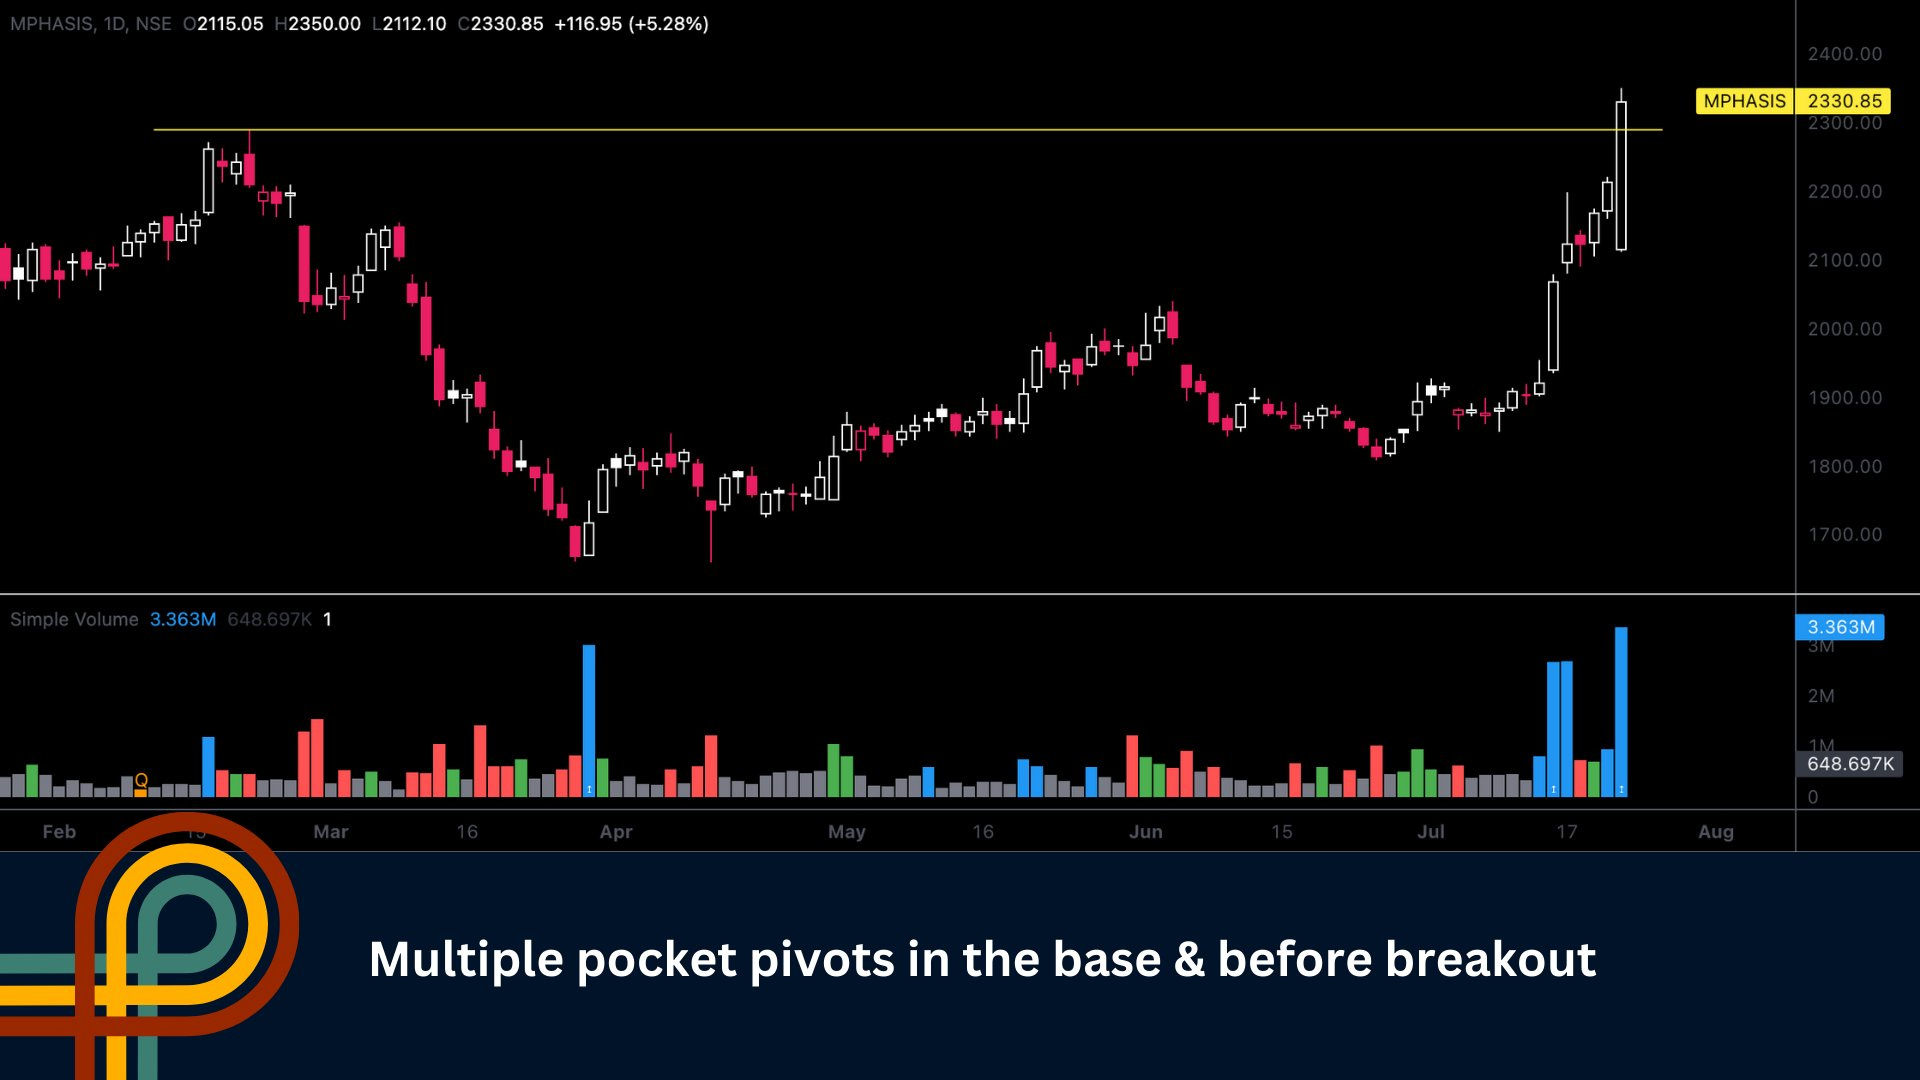
Here’s the much requested Chartink scan for detecting Pocket Pivots. These are depicted as blue bars in the Simple Volume script for Tradingview.

What’s a Pocket Pivot?
Pocket Pivot Volume (PPV) is an up-day volume which is greater than any down-day volume of the last 10 trading days. To the best of my knowledge, there's no accurate Chartink scan for pocket pivots in the public library.
What does this script help with?
⦿ It will identify all the stocks having PPVs, which can give a head start for accumulating a stock within its base formation at a lower-risk price point. Invariably, almost every breakout stock will give PPV at some state of its base formation, or at the pivot point breakout day itself. One can make a cumulative watchlist of the names giving PPVs daily, & act on them when the time comes.
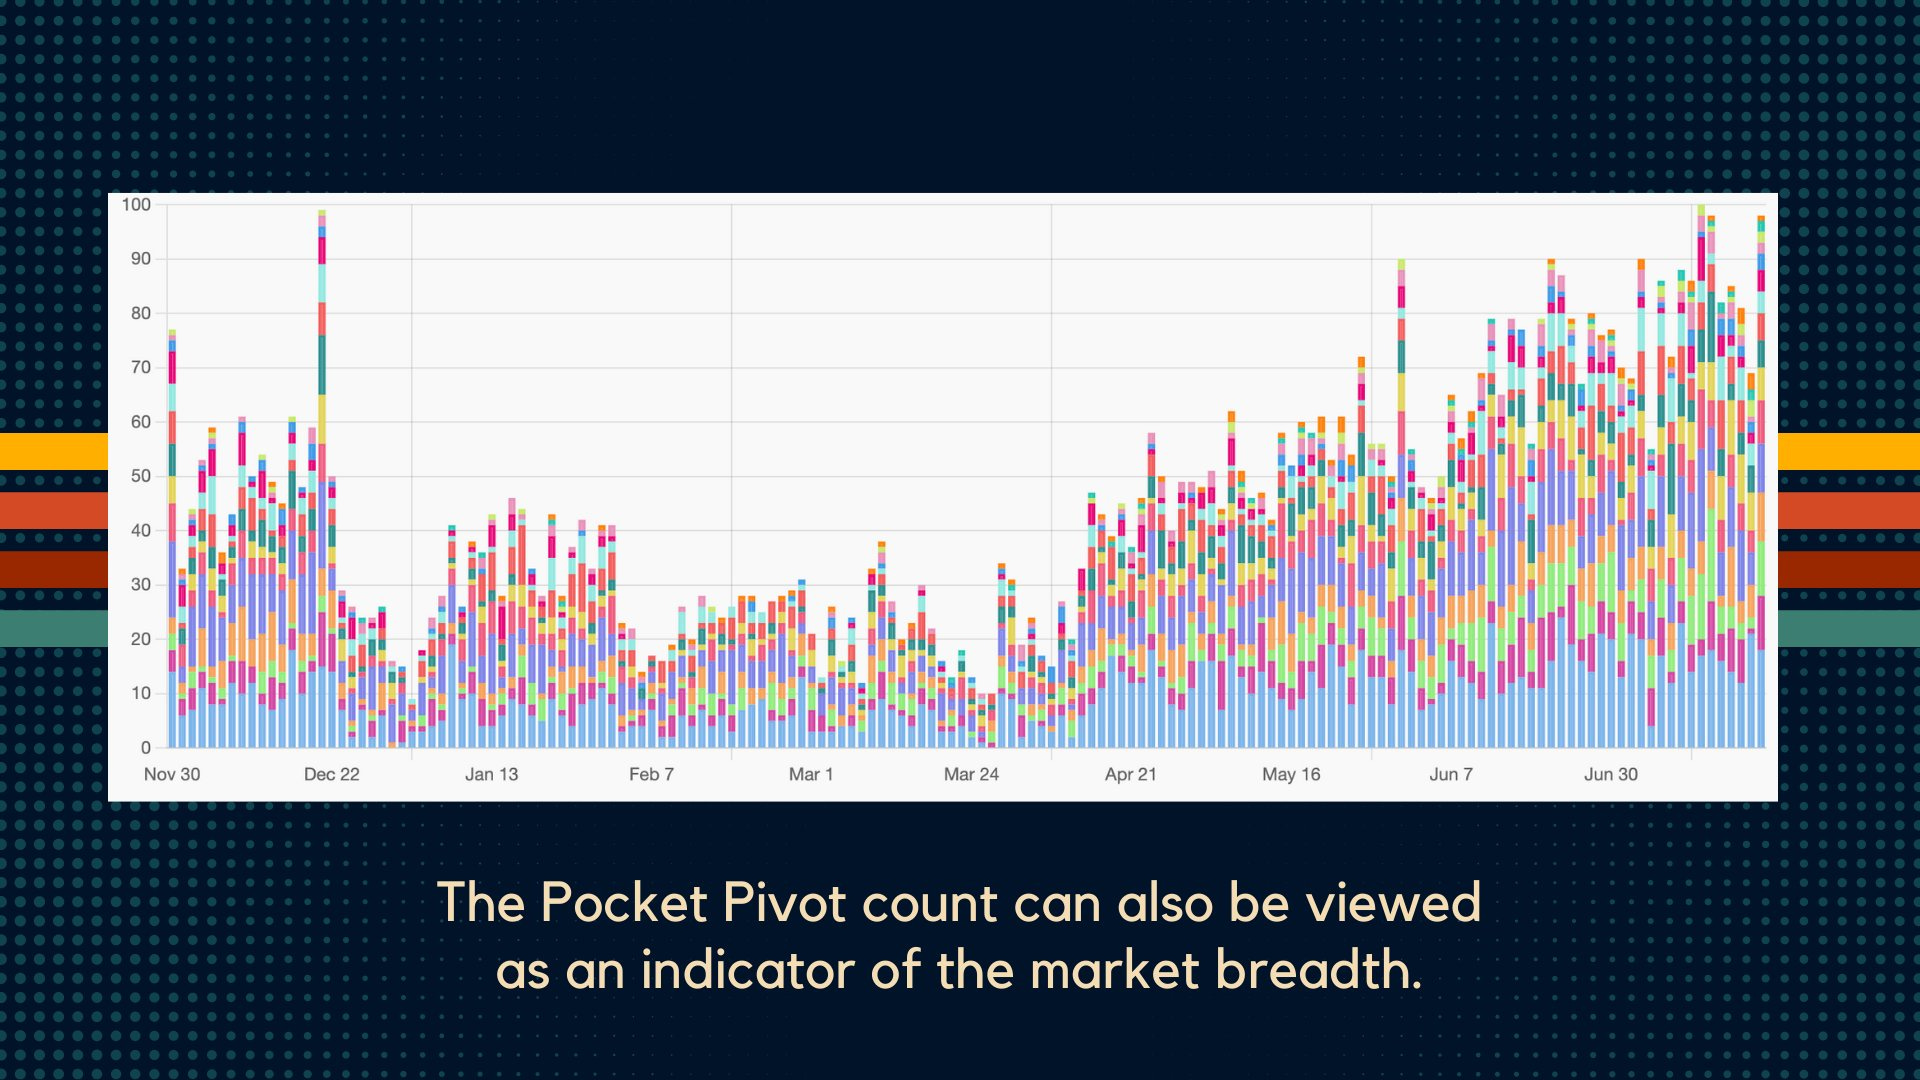
⦿ At the bottom of the Chartink scan page, you can see a backtest graph that displays the number of pocket pivot names in the scan for each day. This count of Pocket Pivots can also be viewed as an indicator of the market breadth. Lesser the count, weaker the breadth, greater tha count, stronger the breadth.
What does this script not help with?
Just because it's a PPV doesn't mean that its buyable today. The context is what's most important. The stock's price cycle, risk reward at the buy point, as well as the general market condition must be conducive.
Options to note
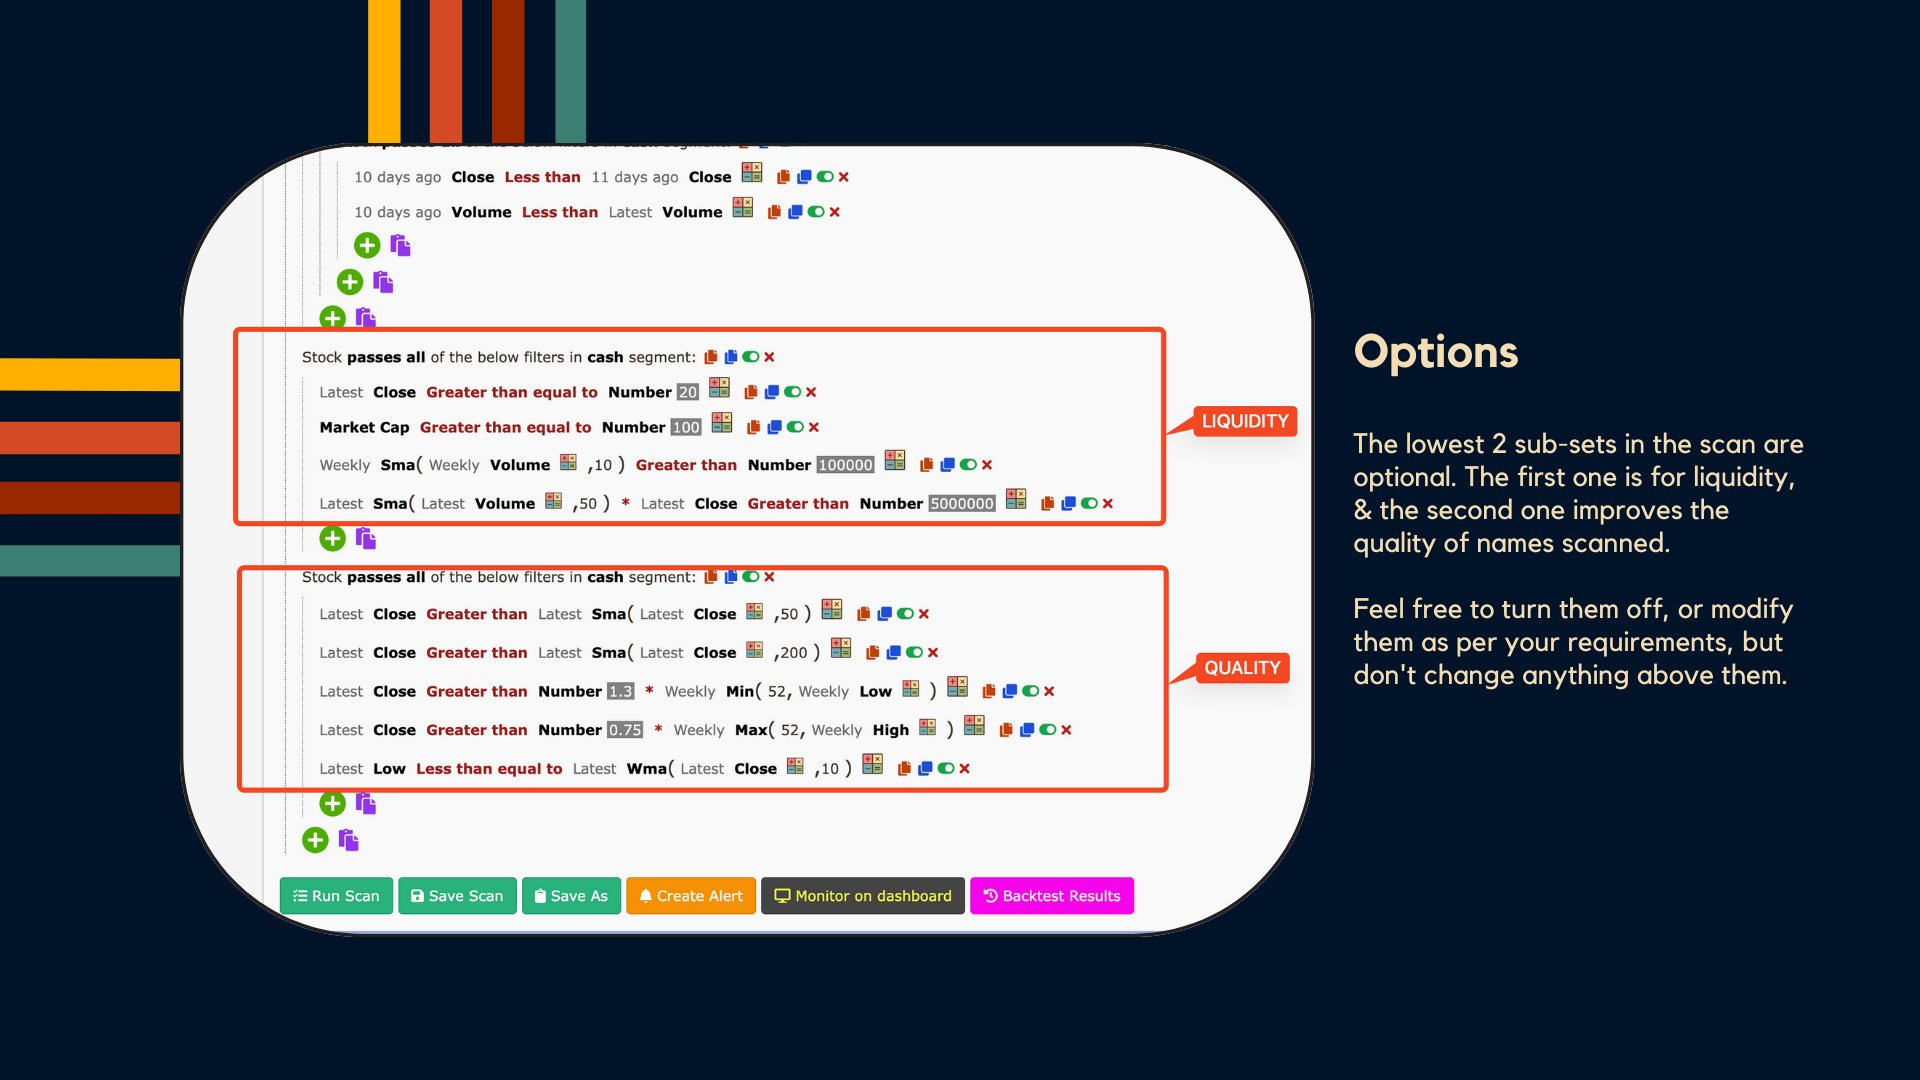
The lowest 2 sub-sets in the scan are optional. the first one is for liquidity, & the second one improves the quality of names scanned. Feel free to modify them as per your requirements, but don't change anything above them.
Here is the link to my Chartink scan for identifying Pocket Pivots.