

Quarterly Earnings
Tradingview Script

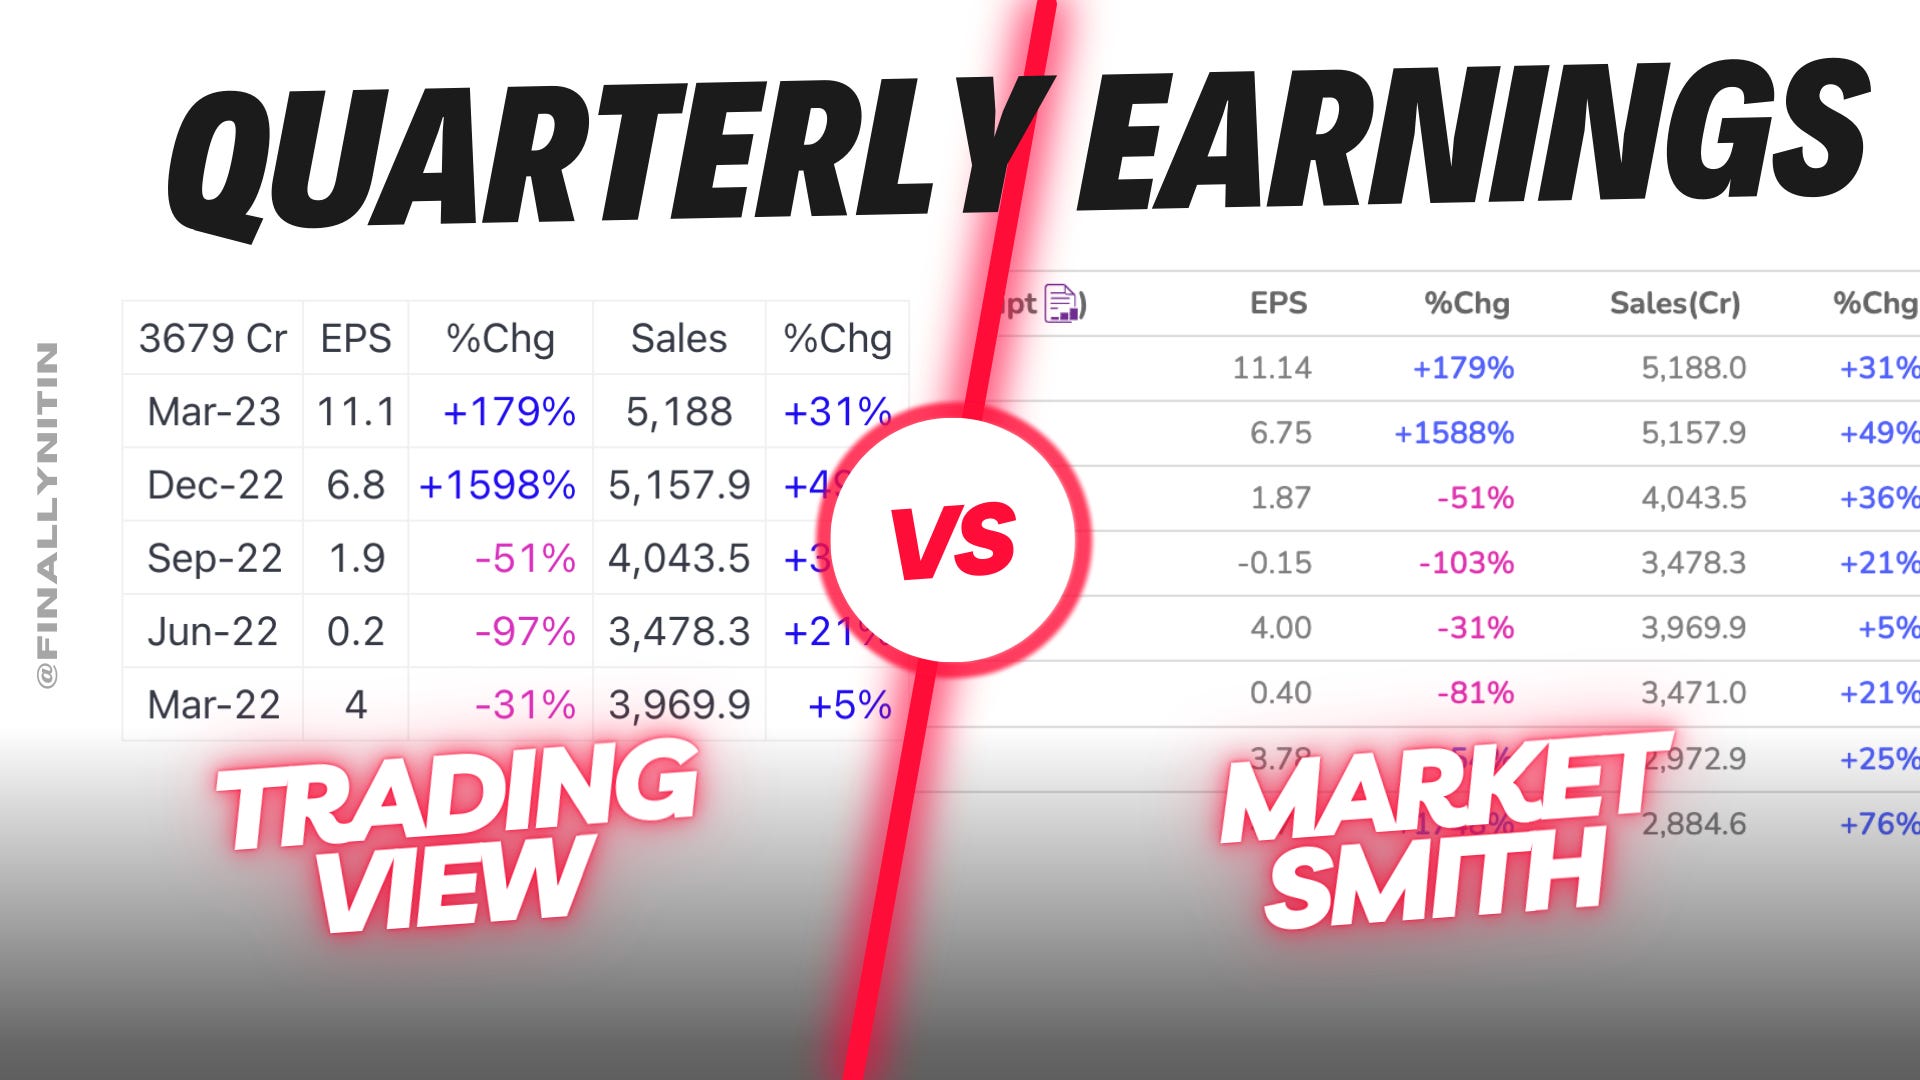
This script displays quarterly earnings per share (EPS) and sales data, and their year-on-year percentage change. The script builds upon the Volume Price and Fundamentals script by Mohit_Kakkar08 and improves upon the array functions to keep the code light-weight & the output as accurate as possible.
Features
View quarterly earnings per share (EPS) and sales data. As this has been designed for Indian markets, the Sales data is in Crores.
The percentage change is a YoY (year on year) comparison of the current quarter to the same quarter of the previous year.
Option to change the data from Quarterly (FQ) to Yearly (FY).
Option to increase the number of previous quarters displayed in the table (default is the past 4 quarters) to any number.
Location & size of the table can be changed.
Option for a 1-click dark mode
Option for a 'Mini-mode' where the values are replaced by traffic lights for a quick visual:
🟢 or 🔵 YoY increase in earnings/sales
🔴 or 🟣 YoY decrease in earnings/sales
🟡 or 🟠 YoY earnings/sales unchanged
⚪️ No data availableThe top-left cell has the option to display either the free float (FF) or the marketcap (Mcap) of the stock.

Disclaimers
⚠️ Please note that sometimes the Tradingview data reflected in the script output might differ a bit from MarketSmith. Also make sure you are viewing the 'consolidated' data there.

🤗 This script was developed as a collaboration between me & my friend, Ganesh @EquityCraze over the period of past 6 months, with lots of back and forth, multiple code revisions & extensive testing on a huge number of stocks. In fact, all credit goes to Ganesh for creating the complicated array functions in the code & helping make the table exactly just like Marketsmith. He deserves all the credit & applause!

Here is the link for the script on TradingView:
Quarterly earnings script for TradingView
In the event of the script getting taken down from Tradingview, here is the link to the source code of the script:
Source code
That’s all for this post.