


The market monitor indicator is a script for TradingView.
The Market Monitor Indicator will help you in tracking sectoral performance and even custom portfolios over varying time periods, which provides insights to identify sectoral rotation and market sentiment.

What Is Sectoral Rotation?
Sectoral rotation is the movement of capital between sectors due to market conditions, macroeconomic factors, or investor sentiment. For example:
Economic expansion: Technology and consumer discretionary sectors often outperform.
Market downturns: Defensive sectors like Pharma & FMCG attract capital.
The Market Monitor Indicator helps you identify these rotations by analyzing sectoral performance across timeframes.
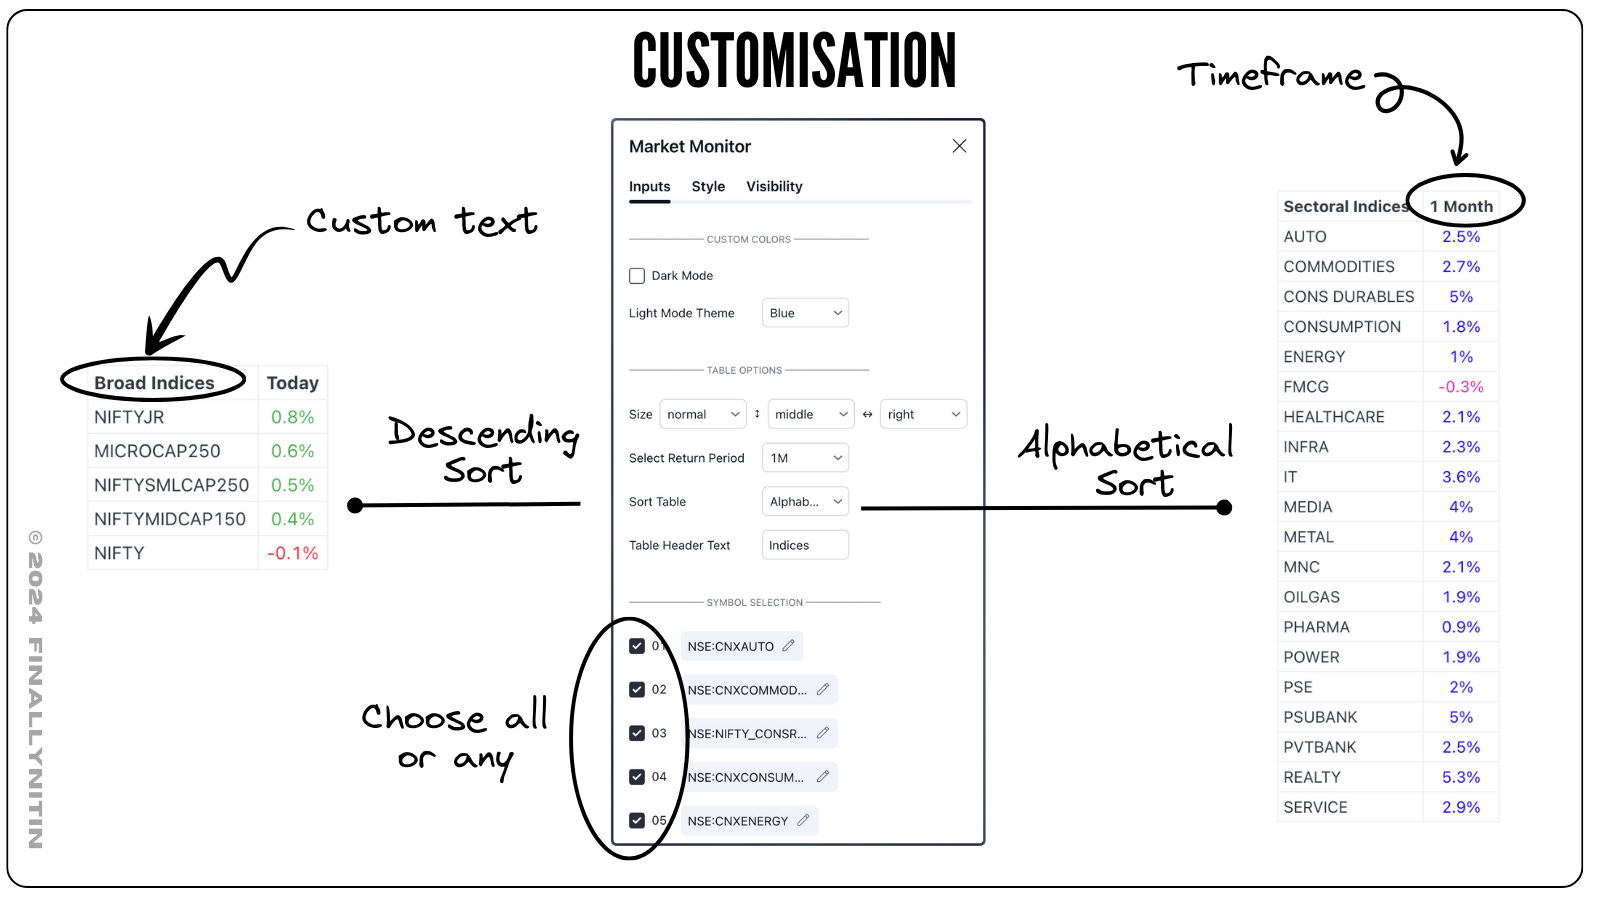
Features of the Market Monitor Indicator
Multi-Timeframe Analysis:
Displays three tables for 1 week, 1 month, and 3 months.
Identifies short-, medium-, and long-term trends.
Custom Symbol Selection:
Track up to 20 indices, sectors, or stocks of your choice.
Include major indices or personal portfolio holdings.
Themes and Dark Mode:
Choose dark mode or light themes (Blue and Green).
Customize text and background colors for better readability.
Sorting Options:
Sort data alphabetically or by performance.
Quickly identify top-performing sectors or stocks.
Visual Insights:
Displays percentage returns, color-coded for gains (blue/green) and losses (purple/red).
How to Use the Indicator for Sectoral Rotation
The indicator reveals money flow into and out of sectors and stocks by showing performance over multiple timeframes. A multi-timeframe analysis reveals early signs of sectoral shifts. Sectors performing well across all timeframes indicate reliable trends. To assess this, we can have the market monitor display varying timeframes like:
Short-Term Momentum (1-Week Table)
Medium-Term Trends (1-Month Table)
Long-Term Shifts (3-Month Table)
Focus on sectors or stocks with strong weekly returns, which indicates fresh money inflows. Validate whether weekly momentum has improved over a month period, while a good 3-month performance signals long-term money flow. Consistent gains across timeframes show strong investor conviction, & highlights broader trends and sector leadership. Allocate more to leading sectors for higher returns, & Reduce exposure to consistently underperforming sectors.
Practical Example
Imagine analysing two sectors: FMCG & PSUBANK
3-month table: FMCG gave 15% returns in 3 months, while PSUBANK were down -8.3%.
1-month table: Over the past month, FMCG gave -2.1% returns, while PSUBANK ishowed improvement by shifting to positive territory with 1.3% returns.
1-week table: PSUBANK are in the top 5 indices for the week with 5% retutnrs, while FMCG is at the bottom.
This suggests that FMCG is losing ground, while PSUBANK index is consistently improving.

Another recent example from MarketQuadrant 50/2024 shows that:
IT & Consumer durables continue as the leaders.
Pharma, Media & FMCG are getting weak.
Realty, Infra & Service indices are improving.

Tips for Effective Use
Use Multiple Instances:
Add multiple script instances with different timeframes for deeper insights.
Customize Themes:
Change the header text as per your requirement.
Use dark or light modes and tailor blue & green to enhance visibility.
Track Portfolio returns:
Customize symbols to track your portfolio’s health and rebalance effectively.
Limitations
One of these is a limitation os the TradingView platform, & another one is of my limited coding capacity:
TradingView has a limit on how many indices can be displayed in a single script, so we can’t have more than 20 queries at at a time. To workaround this, just add multiple script instances of the same script with different timeframes.
The list doesn’t arrange alphabetically while in a custom portfolio mode. I’m loking into this, & as the code is open, you are free to modify & help figure me out the bug there.
Conclusion
The Market Monitor Indicator is a versatile tool for tracking sectoral rotation and money flow. Whether for identifying short-term opportunities or managing a long-term portfolio, the Market Monitor Indicator, with its multi-timeframe analysis, is your ally in staying ahead of market trends.
Start using it today to elevate your trading game!
Ready to incorporate the Market Monitor into your trading toolkit? Start by analysing your favourite stocks and see how this metric aligns with your trading strategy. Remember, knowledge is power—but only when applied wisely.
Link to the TradingView Script
Here is the link to the Market Monitor indicator for TradingView:
Nitin, this is very helpful. What would be killer is ability to support all three timeframes at once on the screen. It will be easy to make inferences when we see all three tables like 1W,1M,3M at once and draw conclusions. Do you mind making that please?
Hello Nitin, I can help you fix limitation #1