

How to read the Market Quadrant
Decode the Quadrant to take informed decisions like a pro


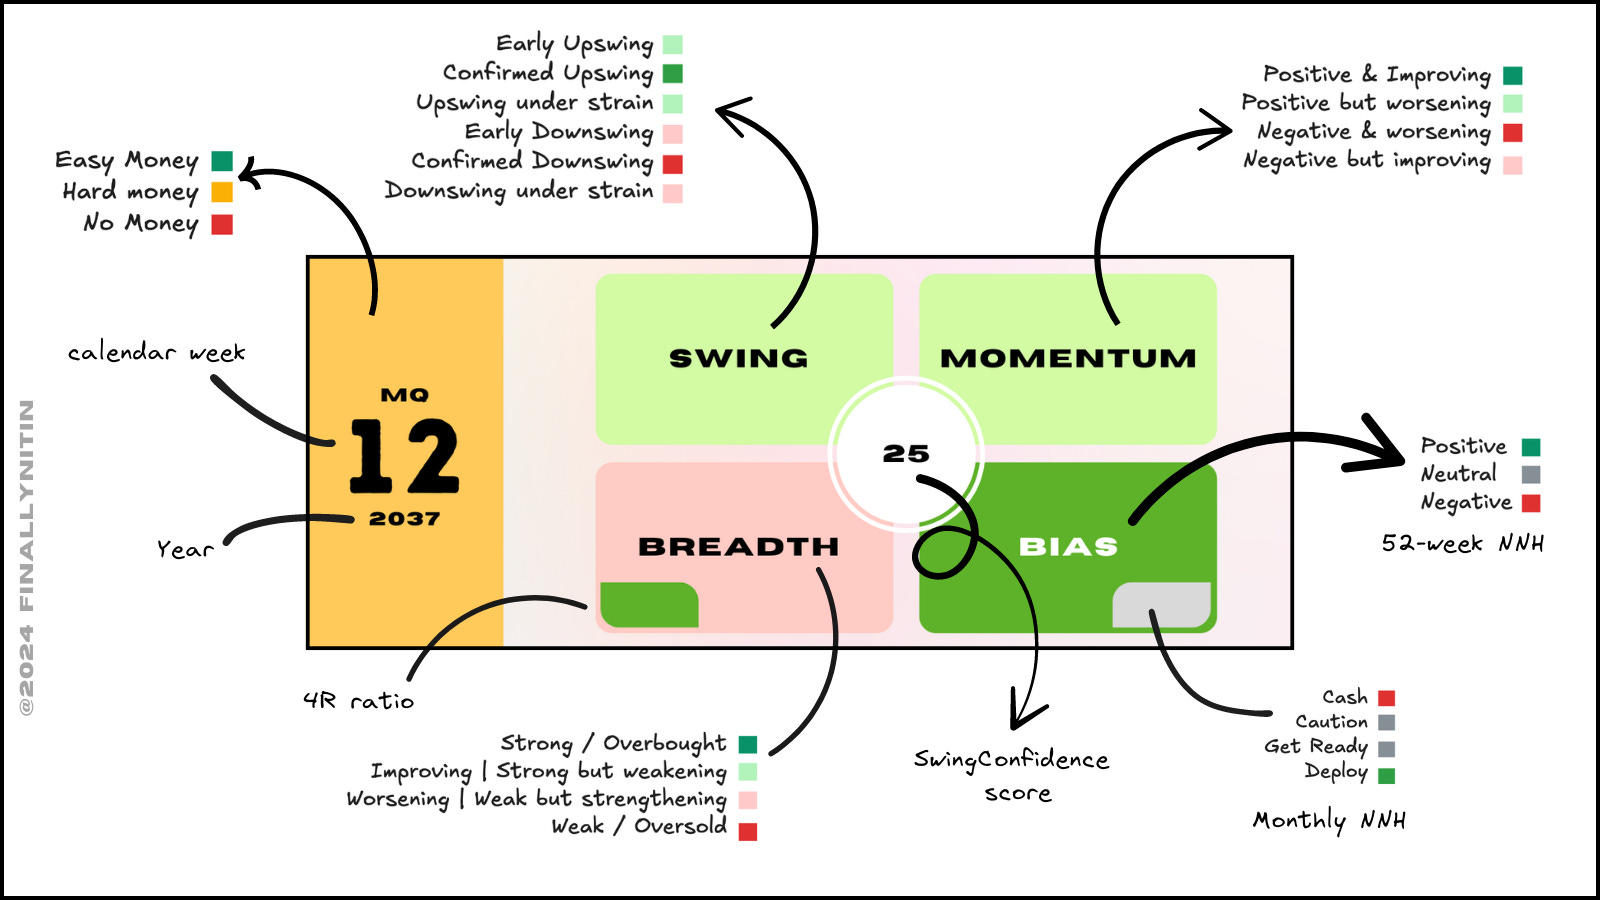
The market quadrant gives us a lot of information that can help us take informed decisions regarding a swing trader’s stance as per the market conditions.
It comprises of 4 metrics:
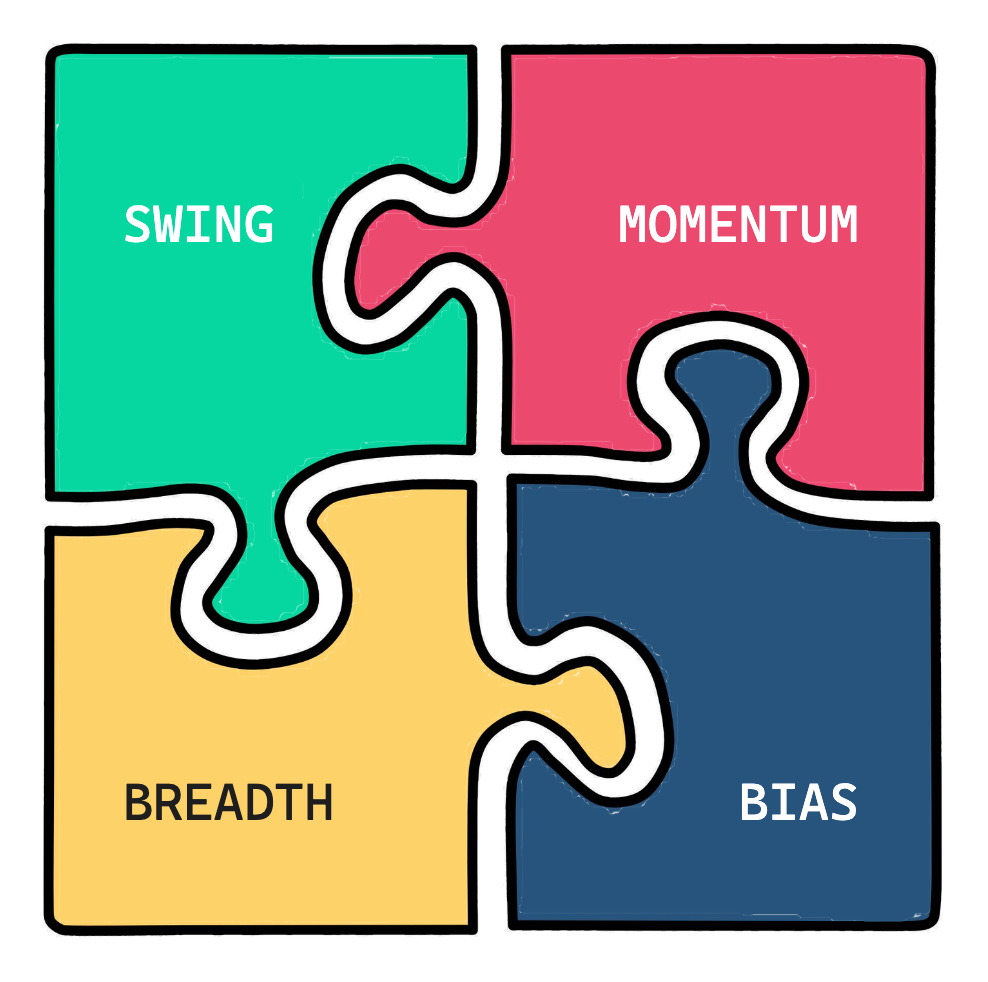
Bias is calculated using 52-week net new highs, monthly NNH & number of indices above 50-day moving average
Breadth is calculated according to the % of stocks above moving averages, & 4% advances & declines.
Momentum is calculated using 10-days rate of change of the broad indices.
Swing state is as per the Simple swing state of the broad indices.
It does not predict the direction of the market. It only shows the current state of the market. It is highly advisable to combine market quadrant with the feedback being given by your portfolio & watchlist. Also, a situational awareness of the market cycle is of paramount importance.
Bias
The Net New Highs (NNH) are used to calculate the bias. Read more about them here:

Bias is calculated using 52-week NNH & number of indices above 50-day moving average. This is the first metric to see whether a swing trader should be participating in the current market or not.
Negative 52-week NNH are a clear sign for the trader to sit out in all-cash. Mostly, by the time the 52-week NNH turn red, most trailing stop losses would have already got taken out, & you would already be in cash.
The monthly (20-day) NNH provide earlier signals than the 52-week NNH. As is the case with all sensitive signals, there is an element of more frequent signals, that may lead one to take more actions than is necessary.
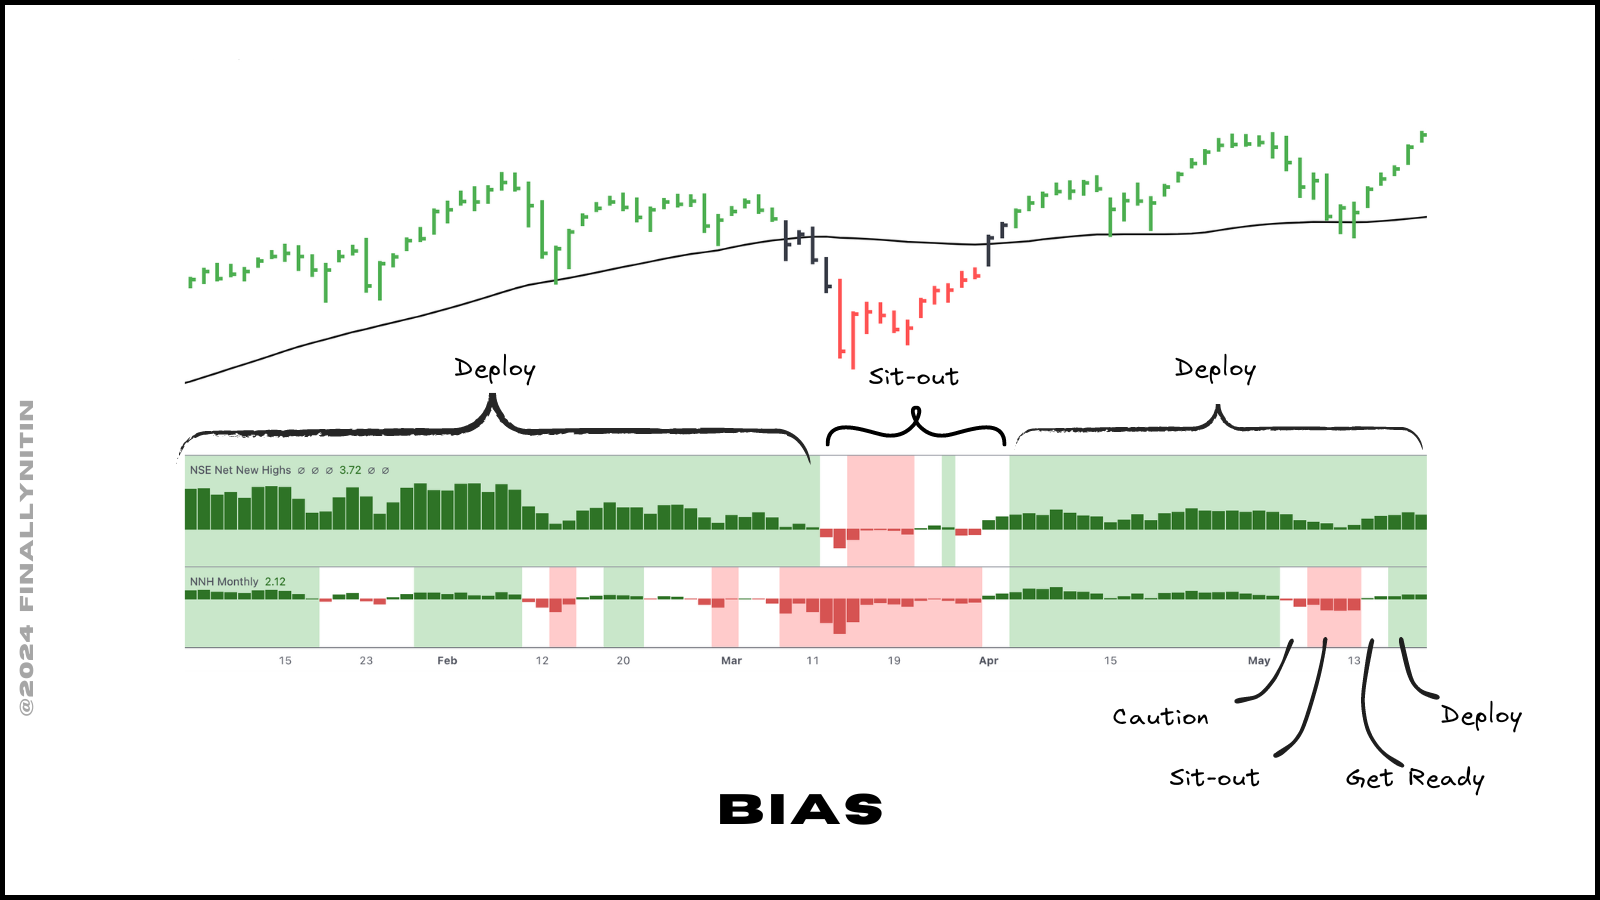
With the 52-week NNH green, when the monthly NNH turn neutral, it is a sign of caution, & one must wait for the monthly NNH to again turn green. This turn of events signifies a pullback in a sustaining uptrend.
But if after turning neutral, if the monthly NNH go all the way red (& the 52-week NNH still green), it would be prudent to sit out from the market completely, till the time the 52-week NNH again turn green.
Other than the NNH, we also want that all the broad indices should be above their 50-day moving averages for a healthy market.
Breadth
Breadth is calculated according to the % of stocks above moving averages. Read more about this here:

The longer-term moving averages (50-day & 200-day) should be above 50 for a market to be considered bullish from a swing trader’s perspective.
If the shorter-term averages (10-day & 20-day) are also above 50, then the market is bullish also in its current state.
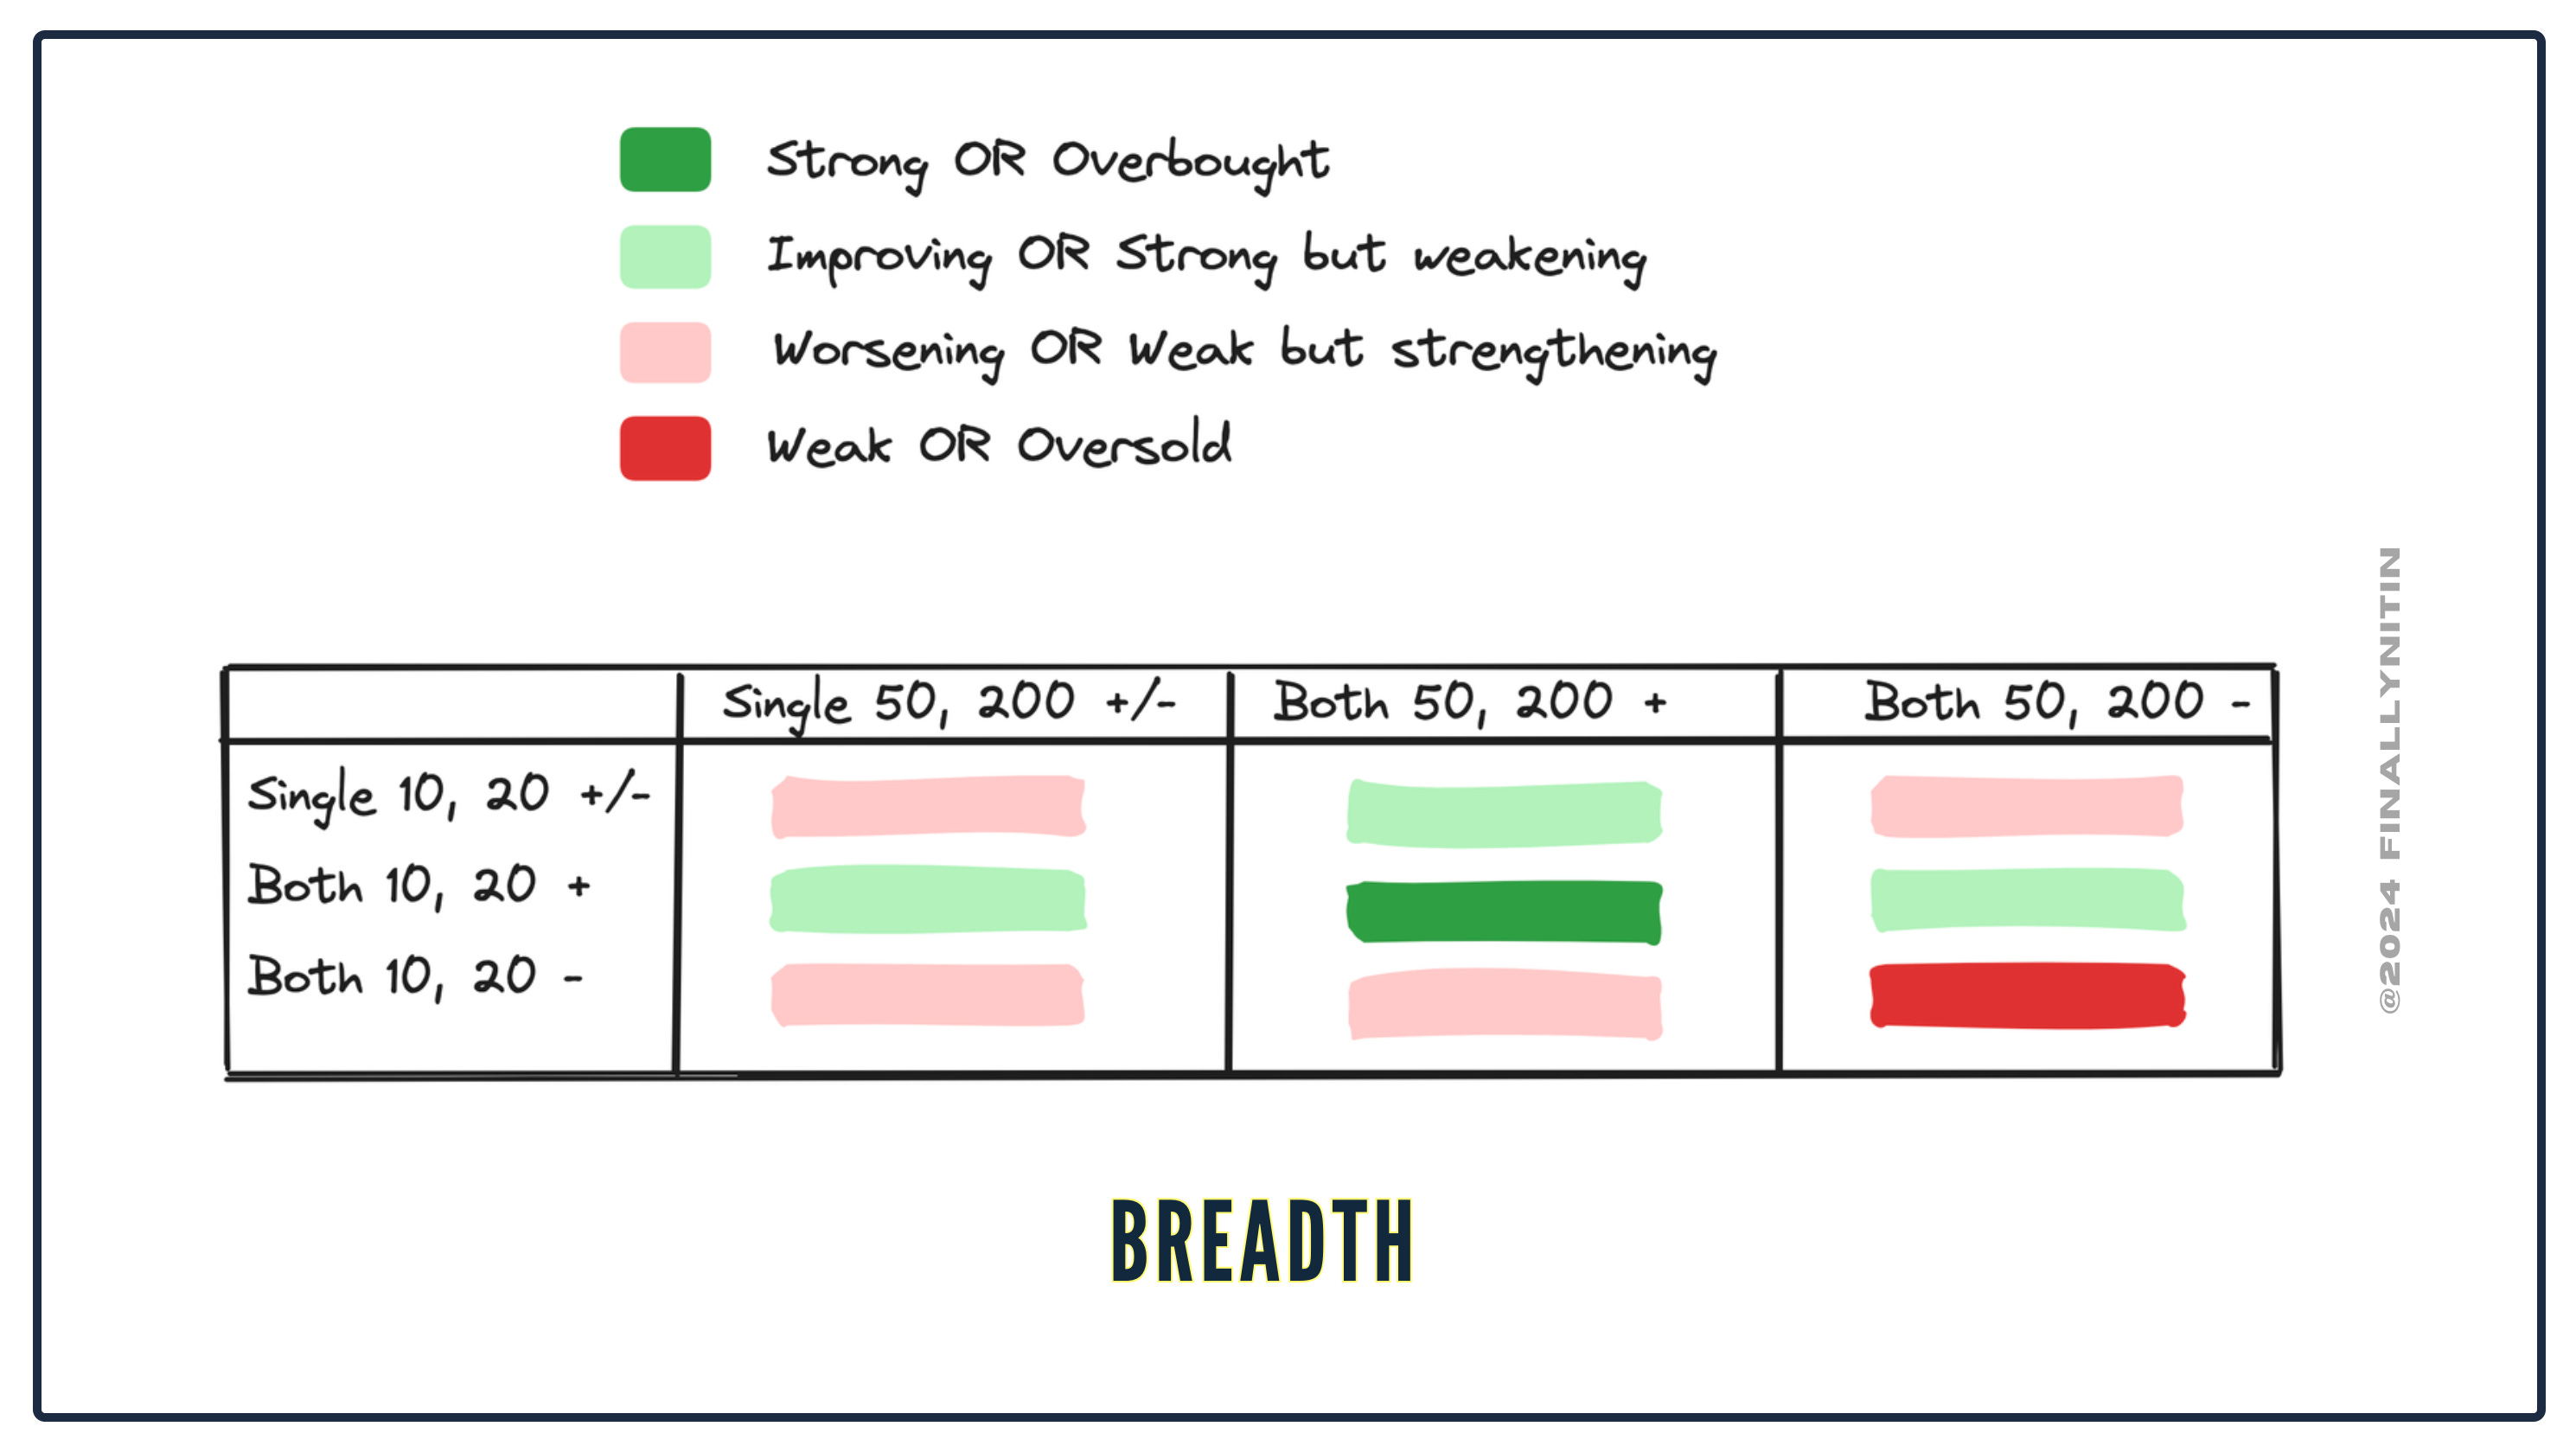
We would like to stay away from the markets when the breadth box in the quadrant is dark red, and cautious when it’s light red. We need it to be green, ideally dark green (all 4 averages above 50).
While the % of stocks above moving averages are more an indicator of breadth with regard to extension, the net breadth as per 4% advance & decline is a better breadth indicator of participation. The market quadrant uses the Stocksgeeks 4R ratio for this, which is simply the ratio between the number of stocks advancing or declining by 4% daily. Read more about this here:
Momentum
Momentum is calculated using the Homma short-term momentum, which is simply the 10-days Rate of change (ROC) of majority of the broad indices. Read more about this here in The Technical Take, one of my favorite blogs:

If the ROC is above the zero line, & also above its 5-period moving average, we consider the momentum as positive & improving. Similarly, if the ROC is below the zero line, & also below its 5-period moving average, we consider the momentum as negative & worsening.
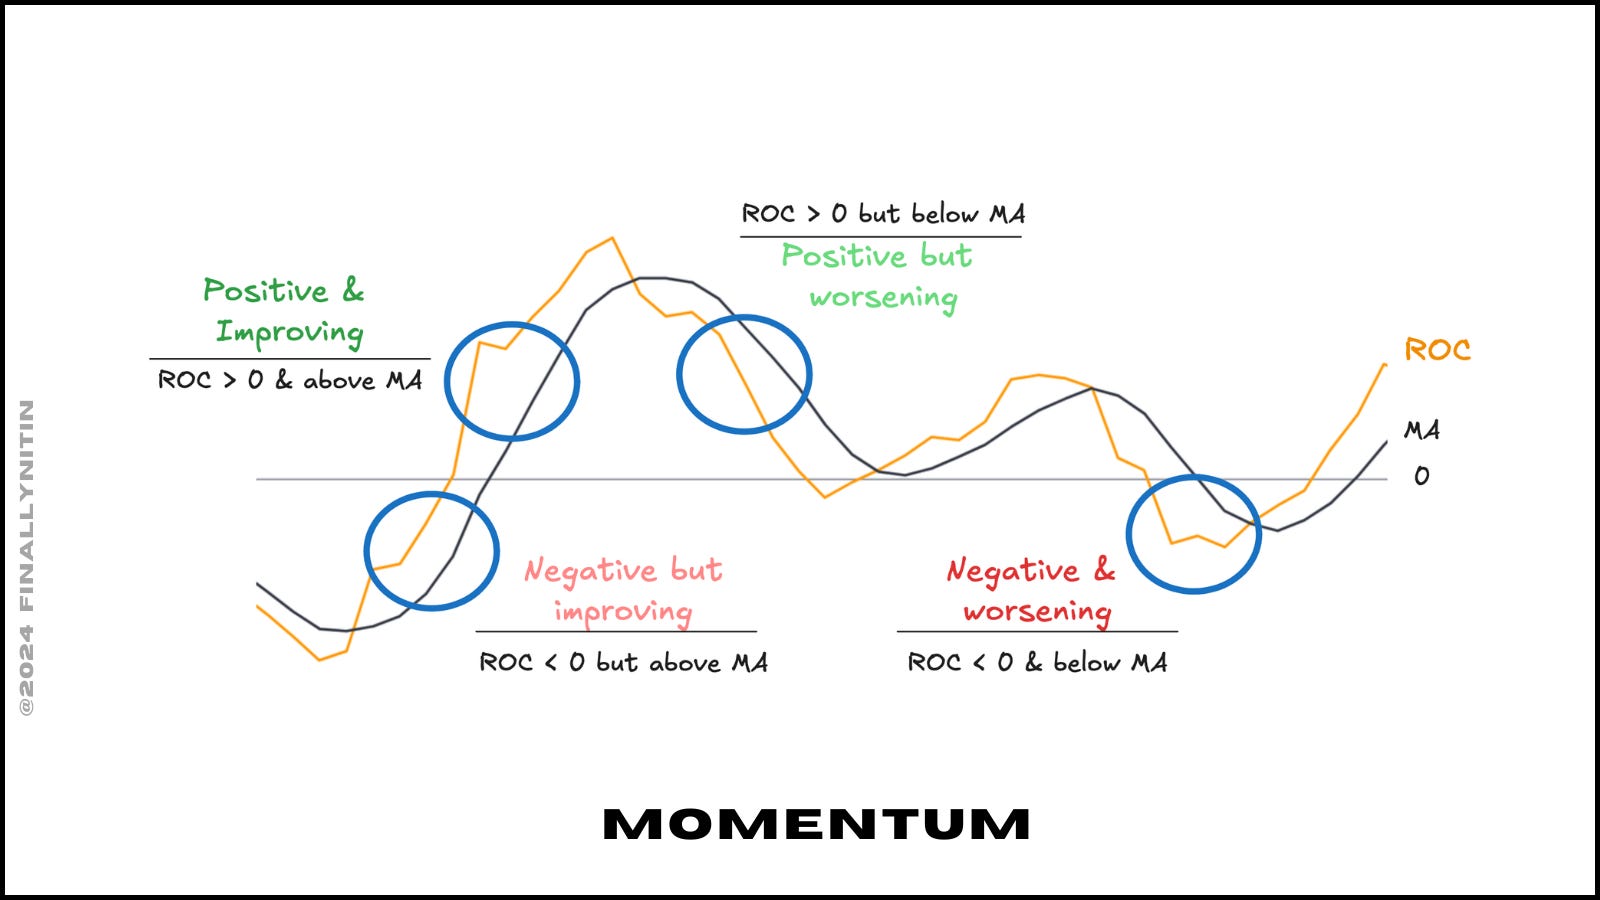
If the ROC is above the zero line, but below its 5-period moving average, we consider the momentum as positive but worsening. Similarly, if the ROC is below the zero line, but above its 5-period moving average, we consider the momentum as negative but improving.
We want the momentum to be ideally positive & improving.
Swing
The Simple swing indicator is used to calculate the swing state. Read more about it here:

We calculate the swing state of 5 broad indices. These are: Nifty 50, Nifty Next 50, Midcap 150, Smallcap 250, & Microcap 250. Apart from a confirmed upswing & a confirmed downswing, we have 4 more states.
If the ribbon is green (fast MA is above the slow MA), & the price is within the green ribbon, then the upswing is under strain. Similarly, if the ribbon is red (fast MA is below the slow MA), & the price is within the red ribbon, then the downswing is under strain.
If the ribbon is still red (fast MA is below the slow MA), but the price has gone above the red ribbon, we are in an early upswing, that will get confirmed once the ribbon gets green. If the ribbon is still green (fast MA is above the slow MA), but the price has gone below the green ribbon, we are in an early downswing, that will get confirmed once the ribbon gets red.
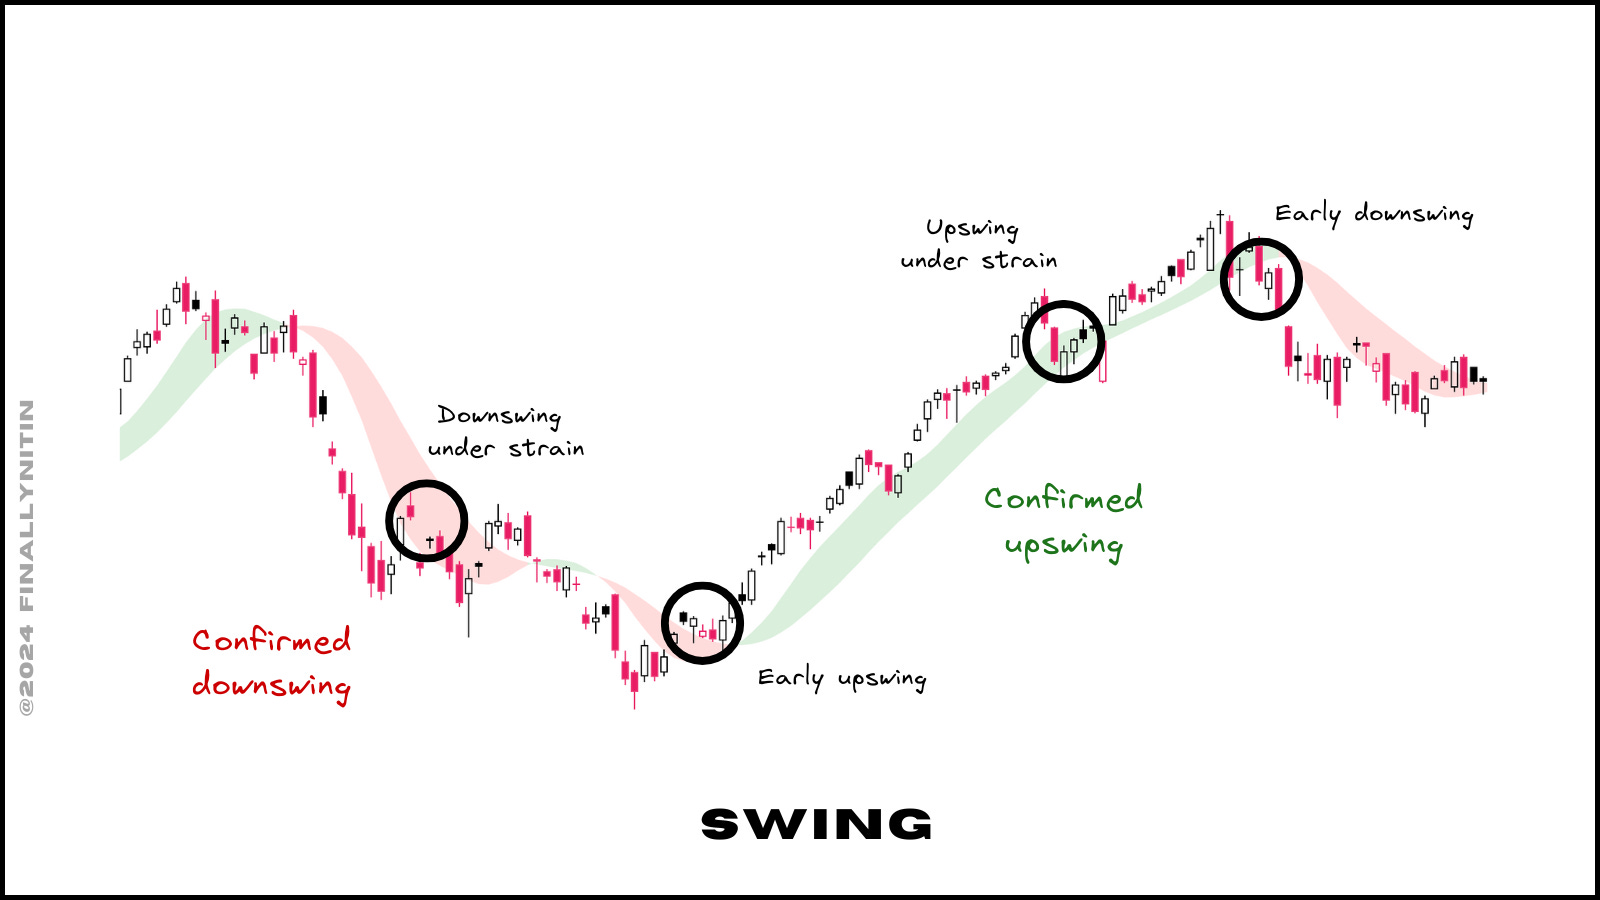
Then, the majority of the swing state from the 5 broad indices is taken as the overall swing state for the day.
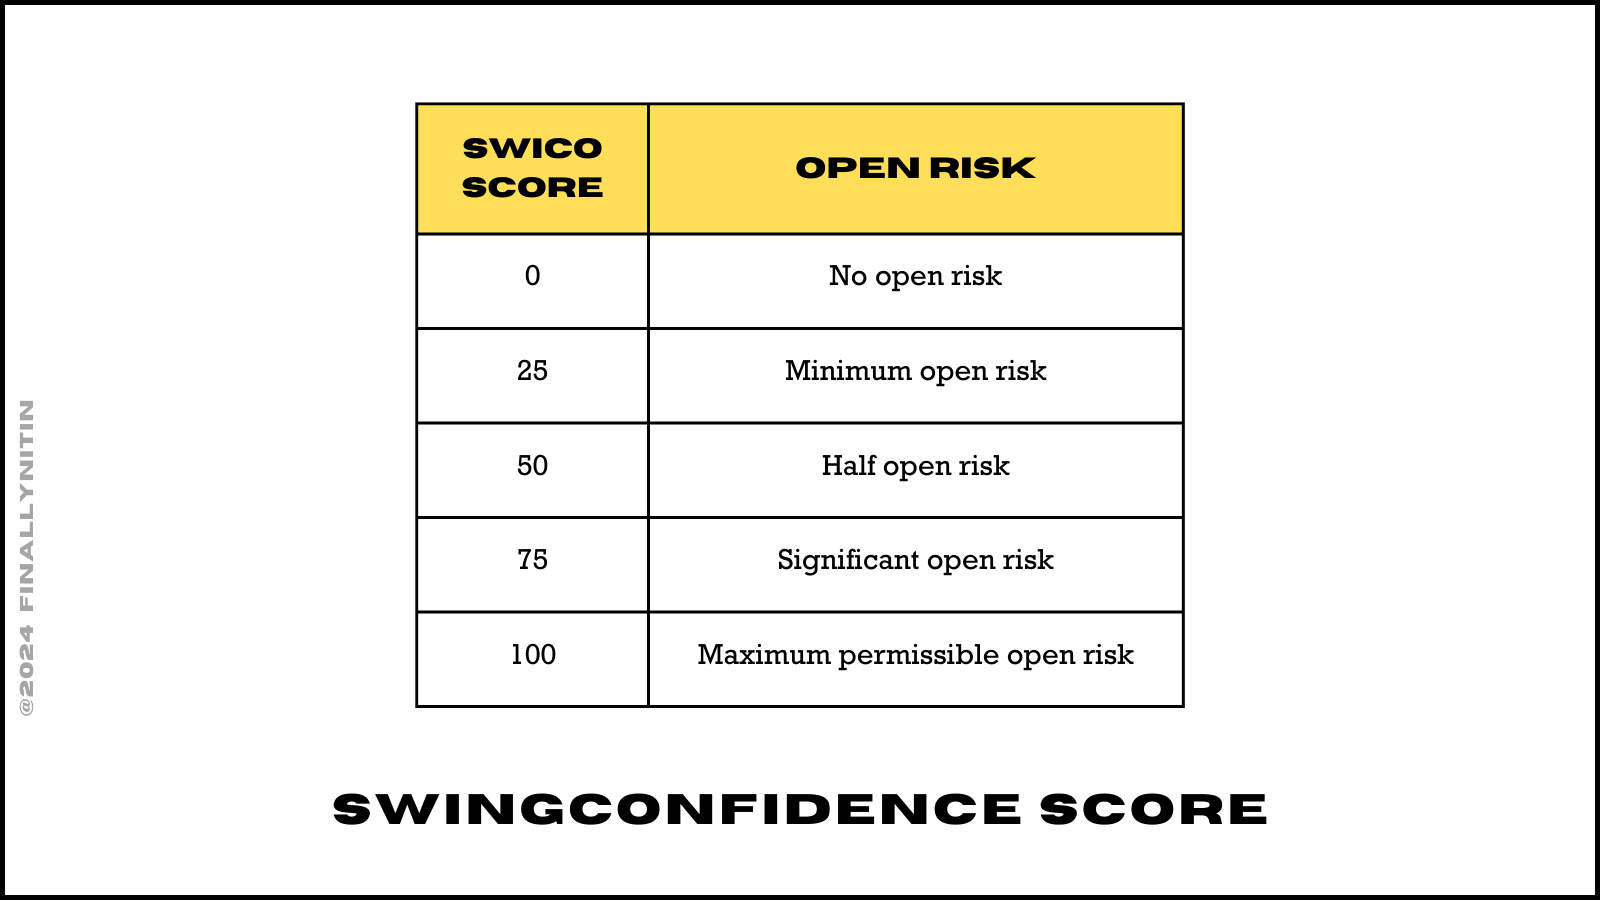
Other than this, the SwingConfidence score helps us decide the open risk to bear. Read more about this here:

The SwingConfidence score can be any one of 0, 25, 50, 75, or 100.
Portfolio Reaction
The personalisation of breadth is done via the feedback you receive from your watchlists & portfolio. One of the best descriptions of this system is described in this post by Stocksgeeks.
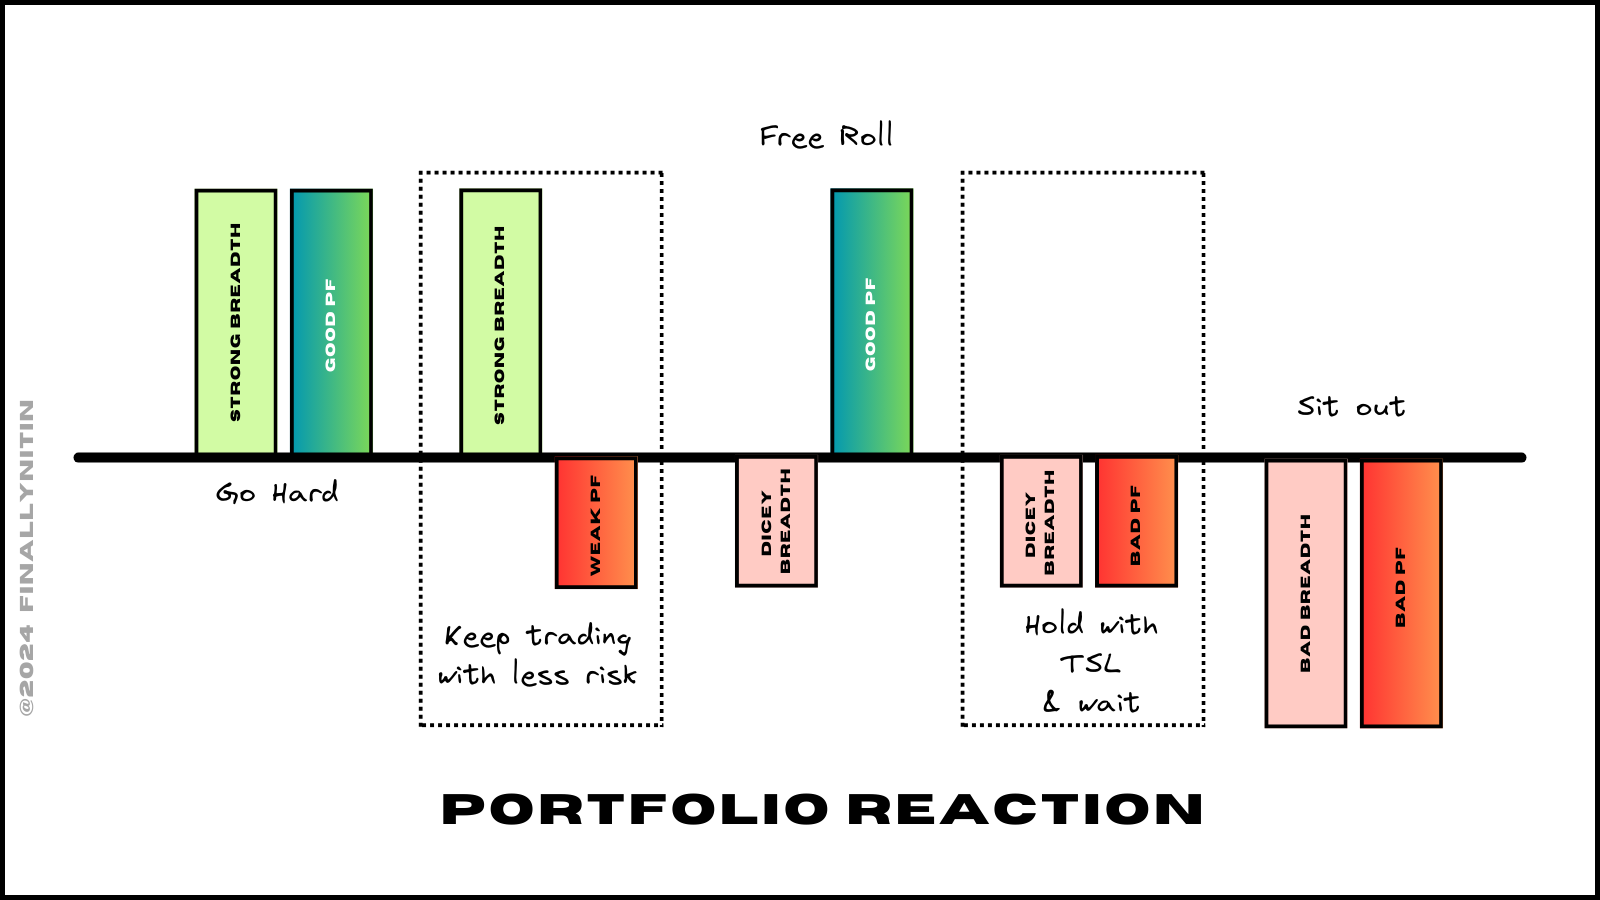
Strong Breadth + Good portfolio stocks reaction = Go Hard
Strong Breadth + Weak portfolio reaction = Keep trading but go with less risk
Dicey Breadth + Good portfolio reaction = Press hard but keep overall PF Risk in check and maybe keep money rotating (Free Rolls)
Dicey Breadth + Dicey portfolio reaction = Hold with TSL and wait
Bad Breath / Bad portfolio reaction = Sit Out and wait for the watchlist to show strength
Taking Informed Decisions
The 52-week NNH bias should be greenfor keeping on trading. The monthly NNH is a better exit signal, & the 52-week NNH is a better entry signal.
The breadth should not be weak. Overbought breadth can stay overbought longer than you can stay invested. Oversold breadth is a signal for technical bounces & reversal trades. Participation should be good, & the 4R should stay largely green. It’s best to stay out once the 4R is red.
The momentum should be improving. Position building should start from below the zero line, & the portfolio should get fully invested soon after it sustains above zero. Reduction in risk/size/open positions can start once the momentum starts to worsen, & by the time it becomes negative, the portfolio should have gotten quite light, if not completely free.
The swing state mostly confirms when the swing has ‘officially’ started or ended. The early upswing is the best place to start deploying capital. However, it should be kept in mind that every early upswing does not lead to a consistent upswing, but every consistent upswing begins with an early upswing. The SwingConfidence score can be used to keep track of the open risk to take, while the swing score of individual indices can be used to identify relatively strong pockets.
The market quadrant is updated every week on my feed here: Market Quadrant
Here is the link to the latest Market Quadrant:

That’s all for now. If you'd like to know when I publish something new, just subscribe to my newsletter and you'll get the latest sent direct to you.